

If you have ever created a website before, you know that underneath all the images, buttons, and menus are lines and lines of computer code. The coding is all textual in nature, meaning it consists of words, numbers, and phrases, but it results in the physical images, lines, boxes and layouts that you see on the website.
Similarly, the numbers, equations, and expressions you are familiar with from your experience with algebra can also be expressed in a visual format – such as in the form of lines and other shapes.
How is this accomplished? That is exactly what we will explore today in this video about the Cartesian coordinate plane.
What is a Coordinate Plane?
René Descartes was a French philosopher who came up with a plane upon which numbers and equations could be graphed. Legend has it that while laying in bed, Descartes noticed a fly on the ceiling and developed his plane to indicate the fly’s position.
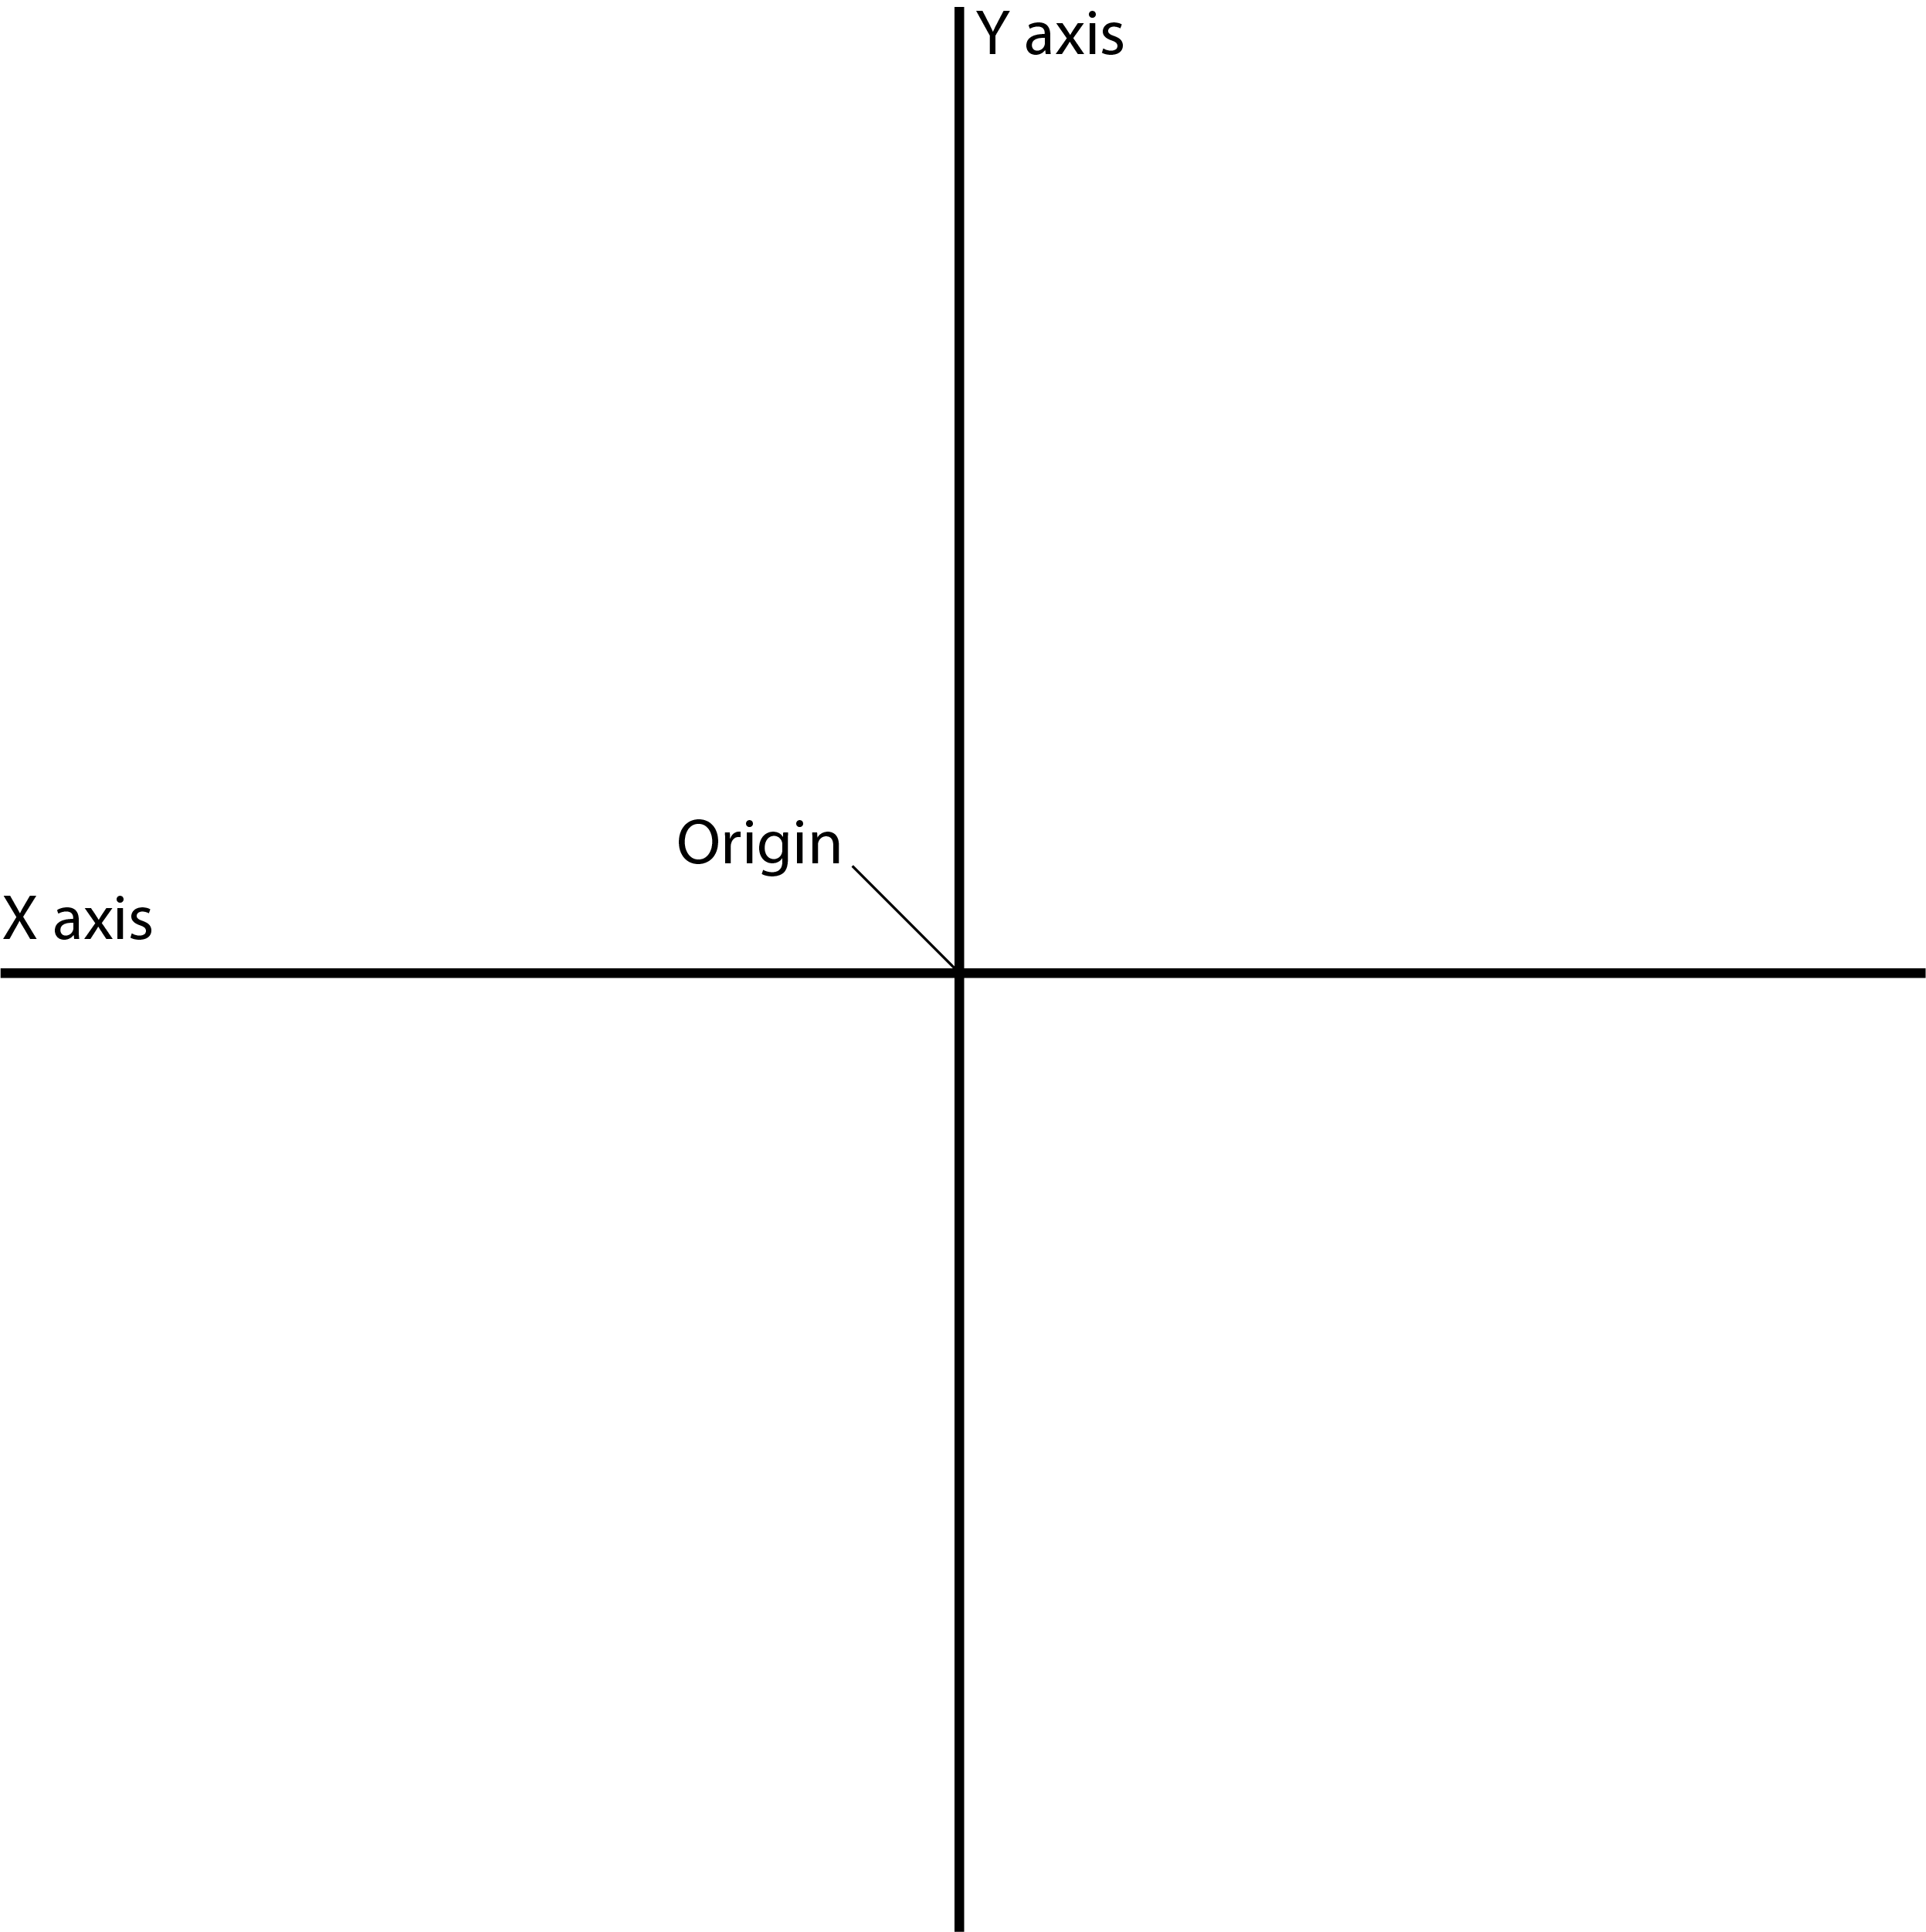
The plane consists of two perpendicular intersecting lines, one horizontal and the other vertical. The horizontal line is called the \(x\)-axis, and the vertical line is called the \(y\)-axis. The \(x\)-axis is used to designate the horizontal location of points on the plane, whereas the y[/latex]-axis is used to designate the vertical location of points on the plane.
\(x\)– and \(y\)-Values
The lines intersect at what is called the origin, which has a value of zero.
Let’s take a closer look at the \(x\)-axis. We’ll begin all the way on the left side and label it -3, -2, and -1. After the origin, which as we mentioned has a value of zero, we’ll continue with 1, 2, and 3. This may look familiar to you as it resembles the traditional number line you may have used to solve math problems.
We do the same thing with the \(y\)-axis, starting at the very bottom, -3, -2 and -1. Then we move above the origin, and we do 1, 2, and 3.
As you can see, points to the left of the origin have a negative \(x\)-value, whereas the points to the right of the origin have a positive \(x\)-value. Similarly, points below the origin have a negative \(y\)-value, whereas points above the origin have a positive \(y\)-value.
Each point plotted on the plane has a set of coordinates, written in the following manner: \((x,y)\). For any given point, we write its location on the \(x\)-axis first, then it’s followed by the location of the \(y\)-axis.
Quadrants
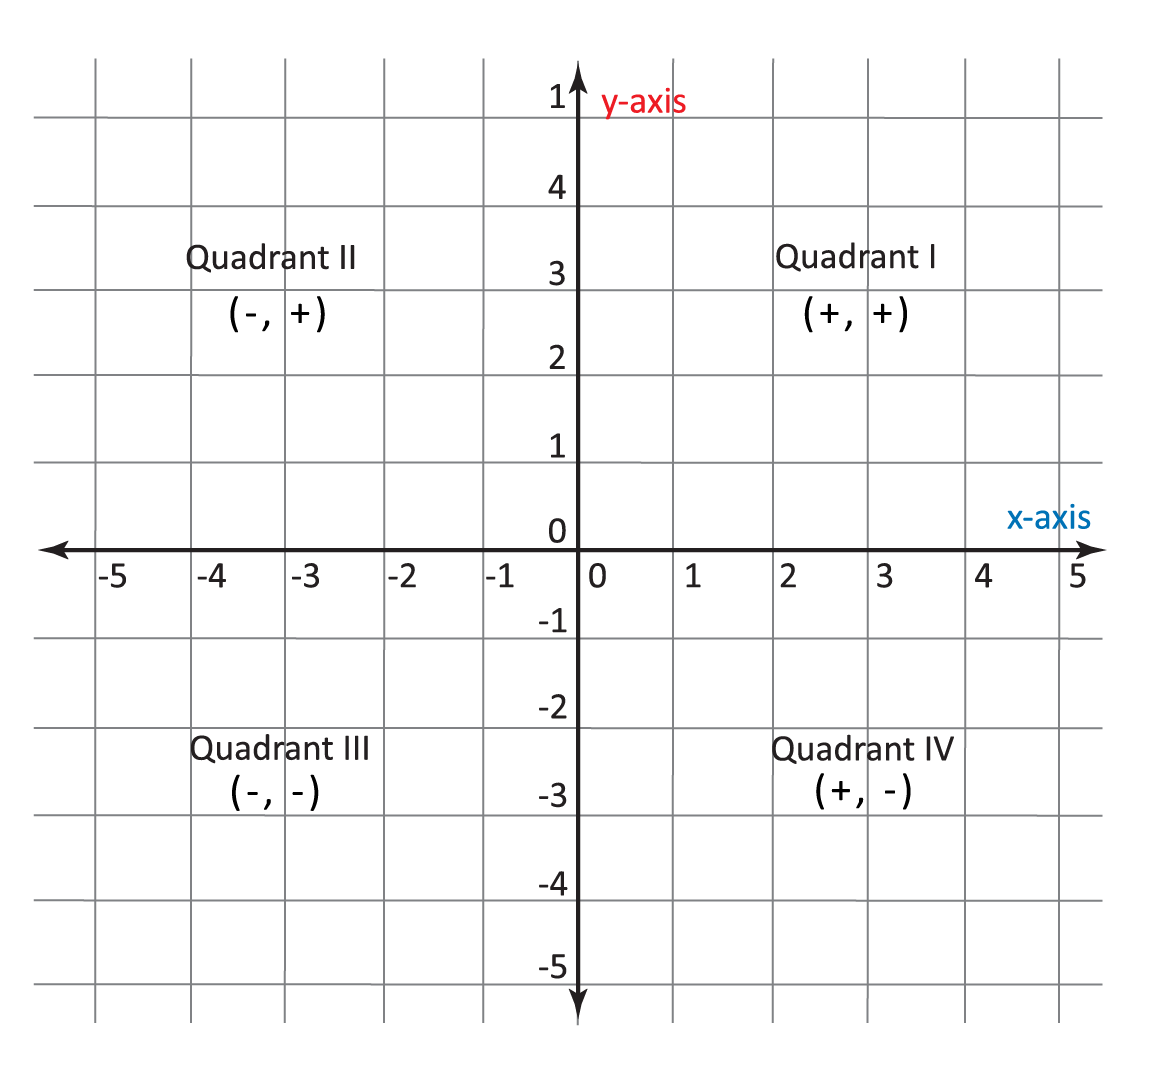
You may have noticed that the plane, with the intersection of the \(x\)-axis and \(y\)-axis, has four “squares.” Each of these squares is called a quadrant. The top right is the first quadrant, the top left is the second quadrant, the bottom left is the third quadrant, and the bottom right is the fourth quadrant.
As you can see, the quadrants are typically labeled using Roman numerals.
Finding Points
To bring it all together, let’s look at some examples.
Say you were given the coordinates of \((1,-2)\). Our first step would be to find 1 on the \(x\)-axis. Then, go down to -2 on the \(y\)-axis, then we mark our point of \((1,-2)\). Let’s try another, say you wanted to find say \((-3,2)\). First we find -3 on the \(x\)-axis, then continue up to 2 on the \(y\)-axis, and we mark our point. It’s important to note that our first point is located on the fourth quadrant, whereas our second point is located in the second quadrant.
Graphing an Equation
Let’s take it a step further and graph a very simple equation. We’ll need an expanded plane, so let’s make one that goes from -5 to 5 on both the x and the \(y\)-axis.
Say you wanted to graph \(y = 2x + 1\).
The first thing we’ll do is draw a table, with one column for \(x\)-values, and another column for our \(y\)-values:
We begin by plugging in values for \(x\), and seeing what the corresponding \(y\)-value will be. Let’s start with an \(x\)-value of -3. So if we have -3, we essentially plug it in to our equation here.
So \(y= 2(-3)+1\). 2 times -3 is -6 plus 1, y is equal to -5. So we plug in -5 here. This makes our first point \((-3,-5)\). Going to our plane, we first find -3 on the \(x\)-axis, then -5 on the \(y\)-axis, all the way down here, and we’ll plot our point.
Now let’s try an \(x\)-value of -1. Once again, we write -1 in the \(x\) column. Now we need to find our corresponding \(y\)-value by plugging it into our equation. So we get 2(-1) + 1. So \(y\) is equal to -2 plus 1 which gives us \(y\) is equal to -1. So we put -1 right here. So now we have our next coordinate as \((-1,-1)\). So first we go to our \(x\)-axis, find the -1 and go down to -1, and draw our mark.
Let’s quickly plot two more points. We’ll try an \(x\)-value of 1. So now we have our next set of coordinates, that’s \((1,3)\). So we go and we find 1 on the \(x\)-axis, then we go up to 3 on the \(y\)-axis. We’ll finish off with an \(x\)-value of 2. So we put 2 in our \(x\) column, then plug it into our equation. So that gives us our next set of coordinates, which is \((2,5)\). So we find 2 on our \(x\)-axis, and then go all the way up to 5 on our \(y\)-axis.
Now that we have our four plotted points, we turn back the clock to the games we played before smartphones came along and “connect the dots” to form a line.
The line ideally shows how we would graphically represent \(y = 2x +1\). It is a visual representation of the equation, and brings our understanding of algebra and geometry to the next level.
I hope that this overview of the Cartesian coordinate plane was helpful! Thanks for watching, and happy studying!
Cartesian Graph Practice Questions
Observe the Cartesian graph below. Which coordinates describe the red point’s location on the plane?

To see this, we first need to determine the point’s \(x\)-value. Where does the point lie along the horizontal \(x\)-axis? The point is right below 4, so 4 is the \(x\)-value.
Second, we determine the point’s \(y\)-value by seeing where it lies along the vertical \(y\)-axis. Notice that the point lies to the right of the −1 on the \(y\)-axis, and we can also see that the point is one “box” or one unit below the \(x\)-axis.
Finally, remember that we list the \(x\)-value before the \(y\)-value when writing Cartesian coordinates. Therefore, the appropriate coordinates for this point are \((4,-1)\).
Inside which quadrant does the point \((4,-1)\) lie?
Look again at the graph from the previous question and where we plotted the point:
Because the point \((4,-1)\) has a positive \(x\)-value, it lies to the right of the vertical axis. And because it has a negative \(y\)-value, it lies below the horizontal axis. The quadrants of the Cartesian plane are ordered starting in the upper right corner and moving counterclockwise, as shown below. Our point is then in Quadrant IV.
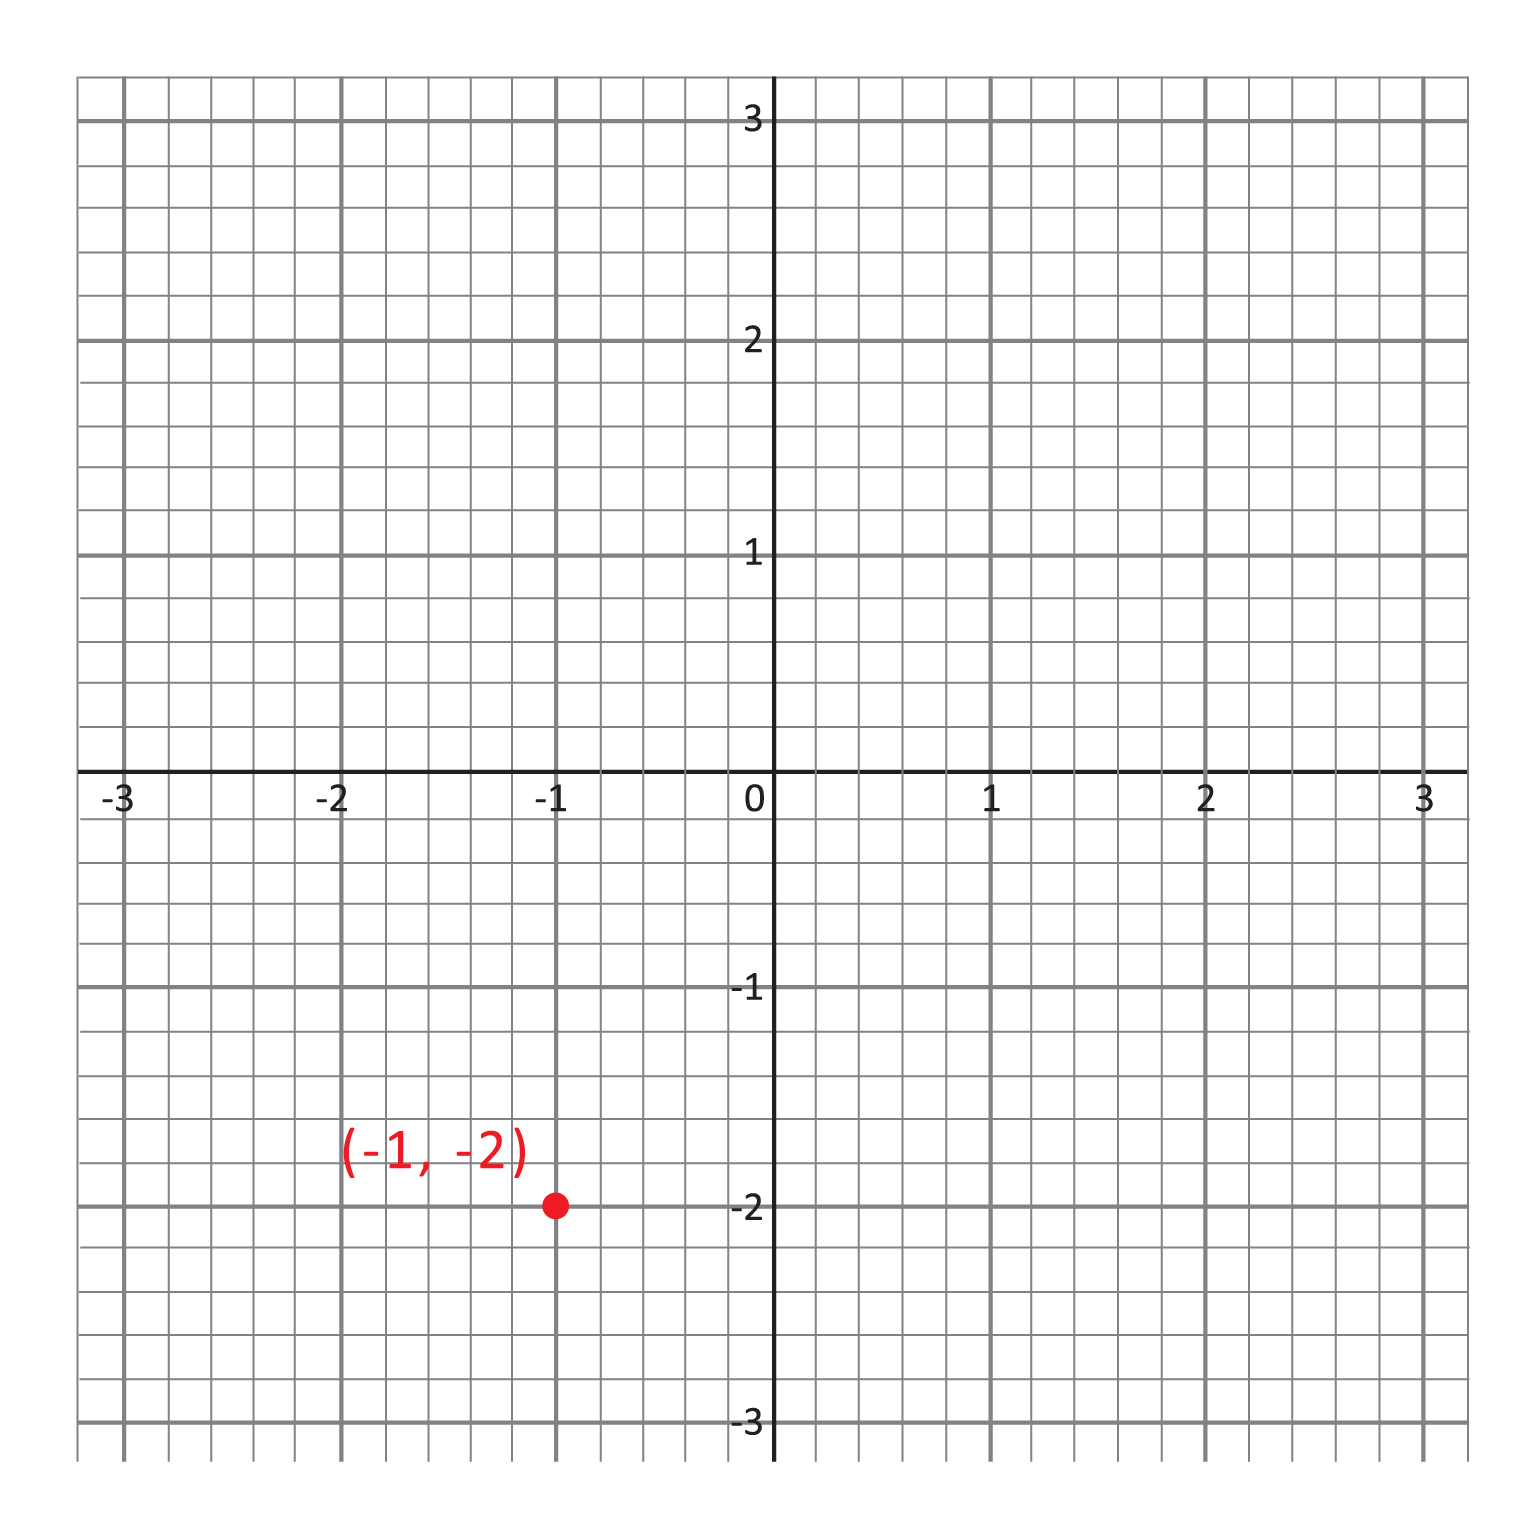
Which quadrant does the point \((-1,-2)\) lie in?
To begin, let’s see where the point \((-1,-2)\) lies on the plane. We find −1 on the horizontal \(x\)-axis, then move down two units until we are at the same height as −2 on the vertical \(y\)-axis.
Now that we know where the point lies, again recall that the quadrants are ordered starting in the upper right corner and moving counterclockwise, as shown below.
From these two illustrations, it is easy to see that the point \((-1,-2)\) is in the third quadrant. As you become more familiar with the quadrants and their ordering, though, you will be able to identify points in the first and third quadrants more easily. Points in Quadrant I have positive values for both \(x\)– and \(y\)-coordinates, while points in Quadrant III have negative values for both.
Consider the equation \(y=\frac{1}{2}x+2\), and find the \(y\)-value when \(x=1\) to complete the table below:
| \(x\) | \(y\) |
|---|---|
| -2 | 1 |
| -1 | 1.5 |
| 0 | 2 |
| 1 | ??? |
| 2 | 3 |
To get this solution, we plug \(x=1\) into the equation we are given.
\(y=\large{\frac{1}{2}}\normalsize{(1)+2}\)
\(y=\large{\frac{1}{2}}\normalsize{+2}\)
\(y=2.5\)
We can also guess this solution by noticing a pattern in the \(y\)-values given in the table. For each increment by 1 along the \(x\)-axis, the \(y\)-values increase by 0.5. We are not surprised to see that our solution is 0.5 more than the previous \(y\)-value (2) and 0.5 less than the next \(y\)-value (3).
This interesting pattern comes from the fraction \(\frac{1}{2}\) right in front of the \(x\) in our equation. Coefficients like this are referred to as the “slope” of a line.
Which of the following points is not on the line described by the equation \(y=-x+3\)?
To see this, we can plug \(x=2\) into the equation.
\(y=-(2)+3\)
\(y=1\)
\(1\neq0\)
When \(x=2\), the height of the line on the plane is 1. In other words, the point \((2,1)\) is on the line, but the point \((2,0)\) is not.
We can check that the other points do lie on the line in a similar fashion. For example, to see that Choice D, \((1,2)\), is on the line, plug \(x=1\) into the equation and see that the \(y\)-value returned is in fact 2, the \(y\)-coordinate of the point.
\(y=-(1)+3\)
\(y=2\)