

Hi, and welcome to this video on graphing functions! Today, I’ll be showing you how to graph a function. Specifically, we’ll focus on the concept of slope, which determines how the function will take shape when we graph it. We will also discuss the relationships between the slopes of perpendicular and parallel lines. Let’s get started!
First, a quick reminder of linear functions. As you can probably guess by the name, a linear function graphs as a straight line on the Cartesian plane. The line represents every point on the plane that satisfies the linear equation.
Each point can be expressed as an ordered pair \((x,y)\), which represents the units on the \(x\)-axis and the units on the \(y\)-axis. The slope of the line is determined by measuring the vertical distance between the y-values of any two points on the line and dividing by the horizontal distance, as determined by the \(x\)-values of those points.
Example #1
Let’s take a minute to apply this information with a few examples.
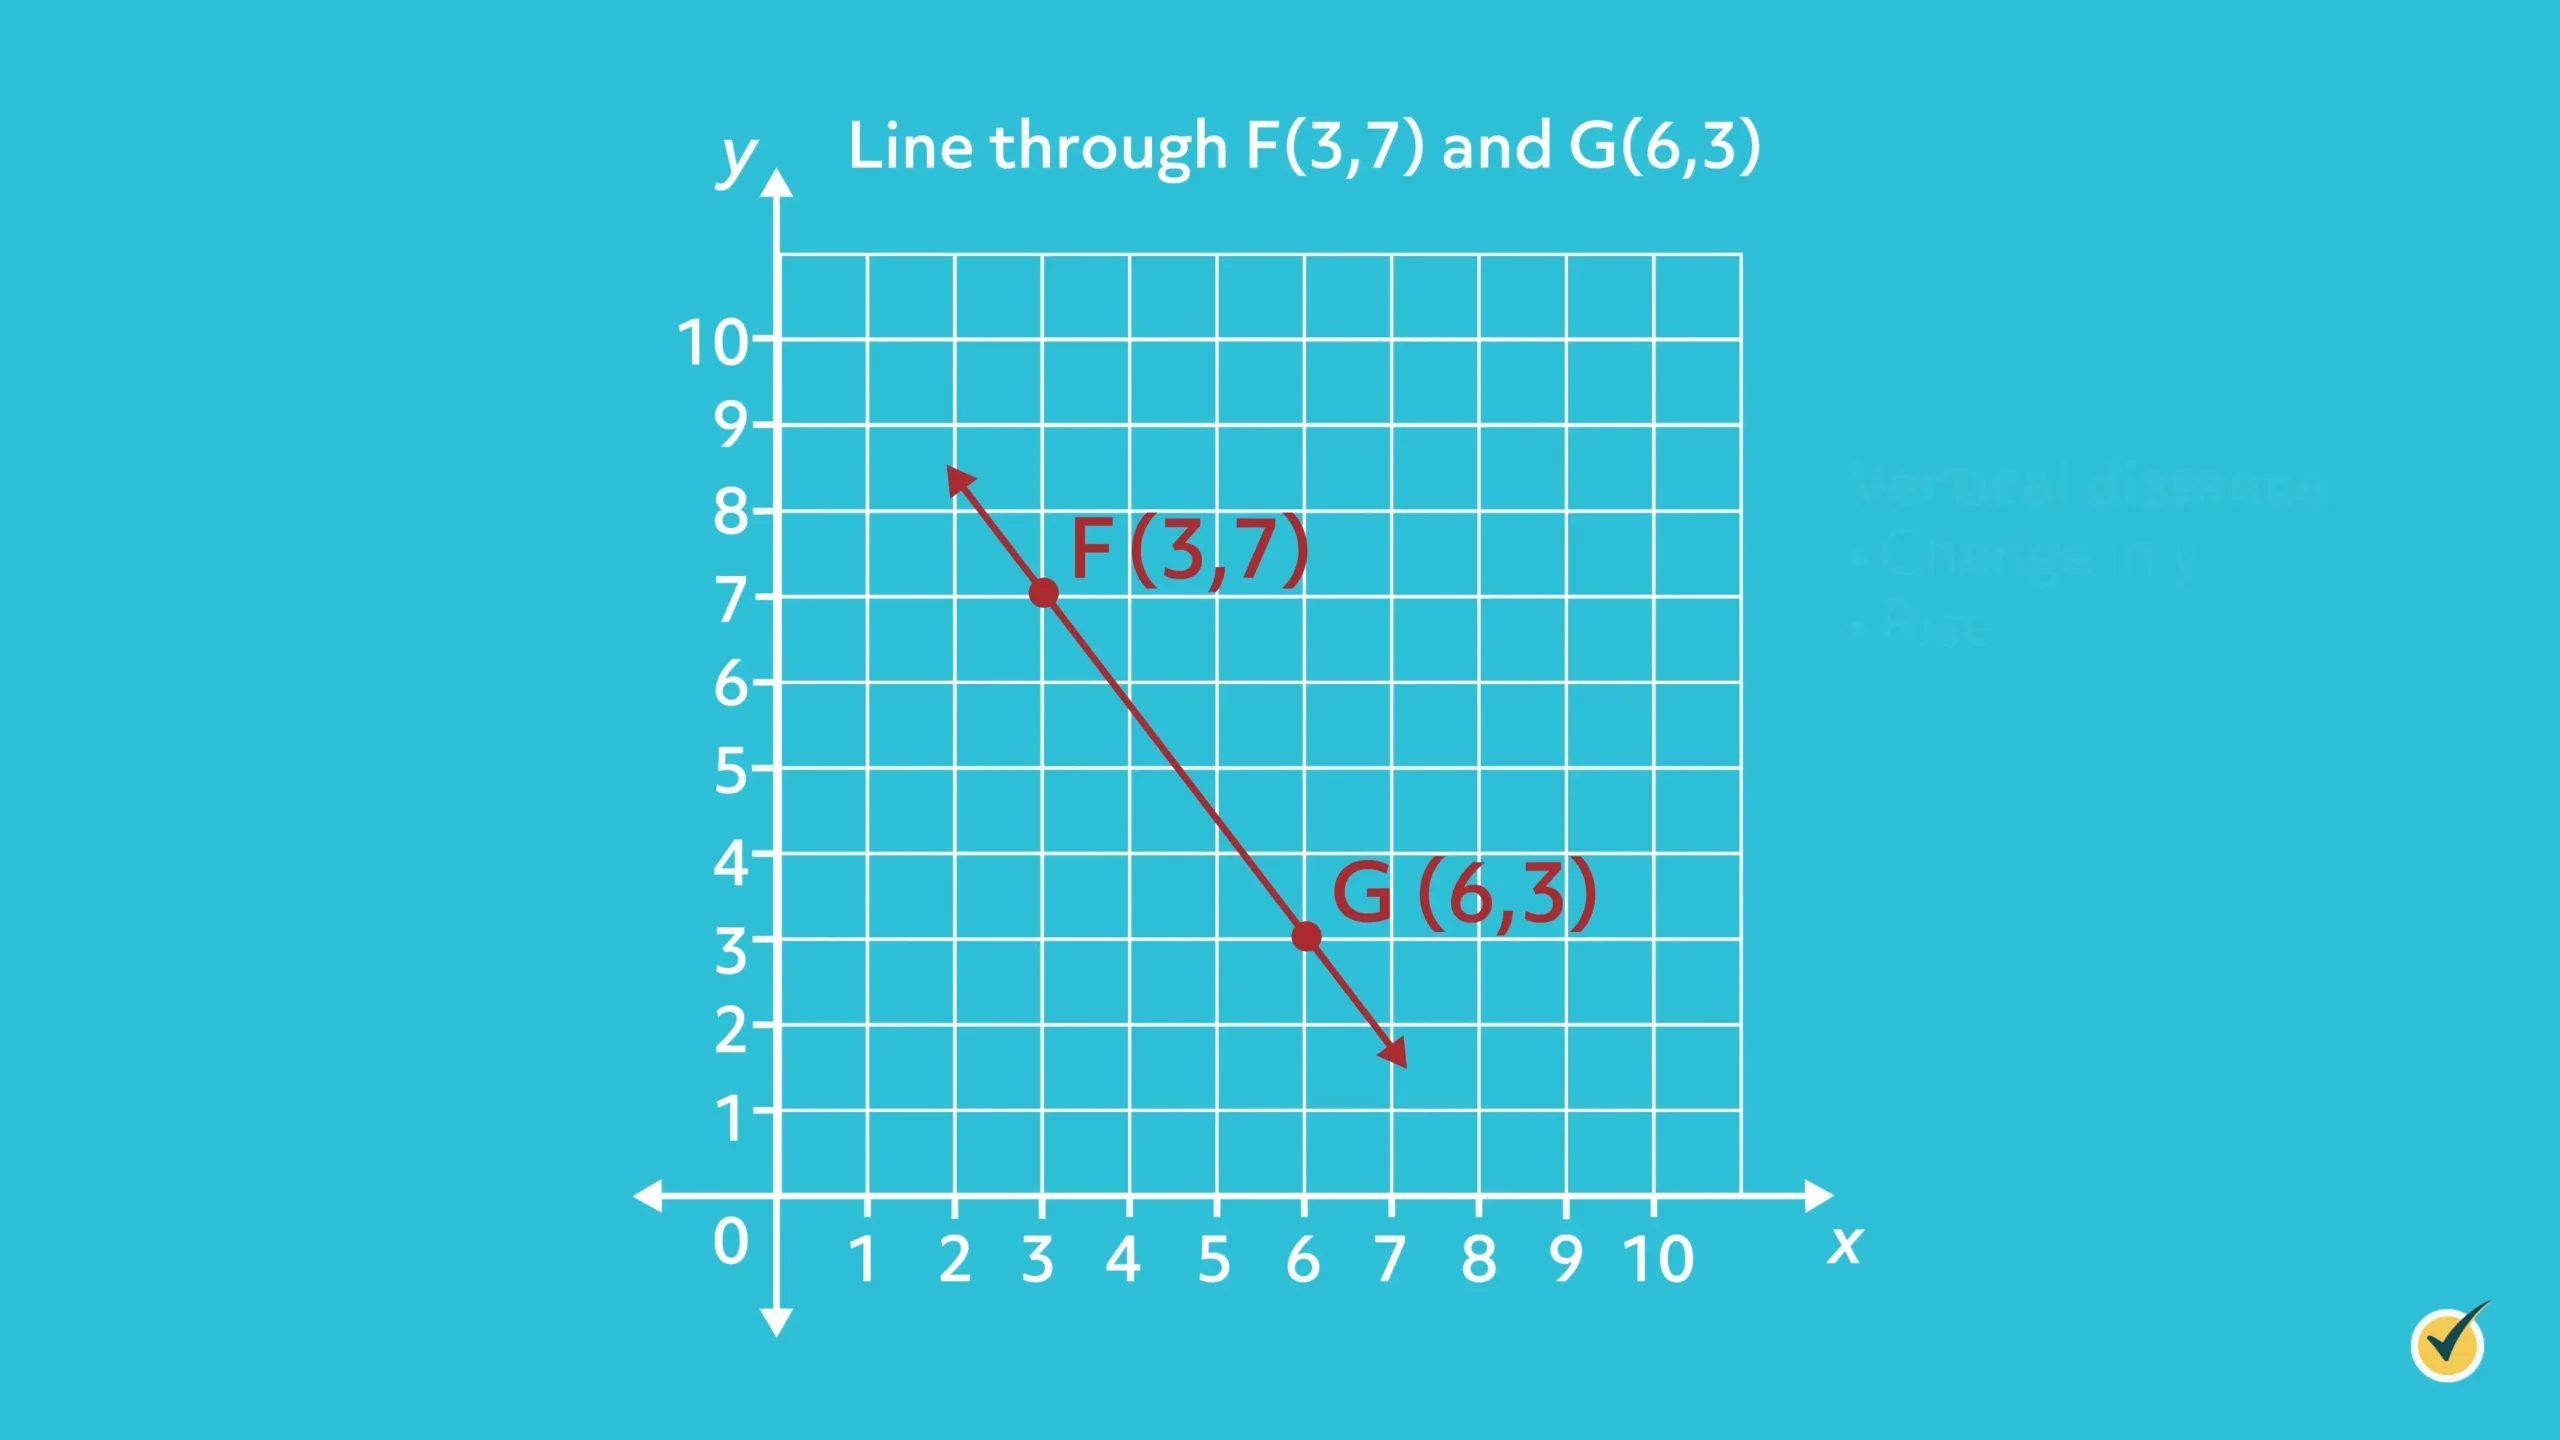
Determine the slope of the line that passes through the points \((3,7)\) and \((6,3)\).
The vertical distance, sometimes referred to as the “change in \(y\)” or “rise”, is calculated by subtracting the \(y\)-values of these two points: \(7-3=4\).
The horizontal distance is known as the “change in \(x\)” or “run”, and is calculated by subtracting the \(x\)-values: \(3-6= -3\).
Note that the subtraction must be consistent! We subtracted both of the coordinates of the point G from the coordinates of point F.
The slope of this line is, therefore, \(\frac{change\; in\; y}{change \;in\; x}\), or \(\frac{-4}{3}\). It is important to note that a negative slope indicates that the line slopes downward, from left to right.
Example #2
Let’s look at another example.
Calculate the slope of the line that passes through the points \((1,1)\) and \((4,3)\).
- Step 1: Calculate the change in \(y\).
- Step 2: Calculate the change in \(x\).
- Step 3: Calculate slope by dividing the change in \(y\) by the change in \(x\).
The line with a positive slope will slant upward, from left to right.
The ability to analyze a graph and knowing the attributes of slope are important skills.
There are two special types of lines that do not follow the rules noted above with regard to slanting up or down, according to the sign of their slope.
Example #3
Here’s another example:
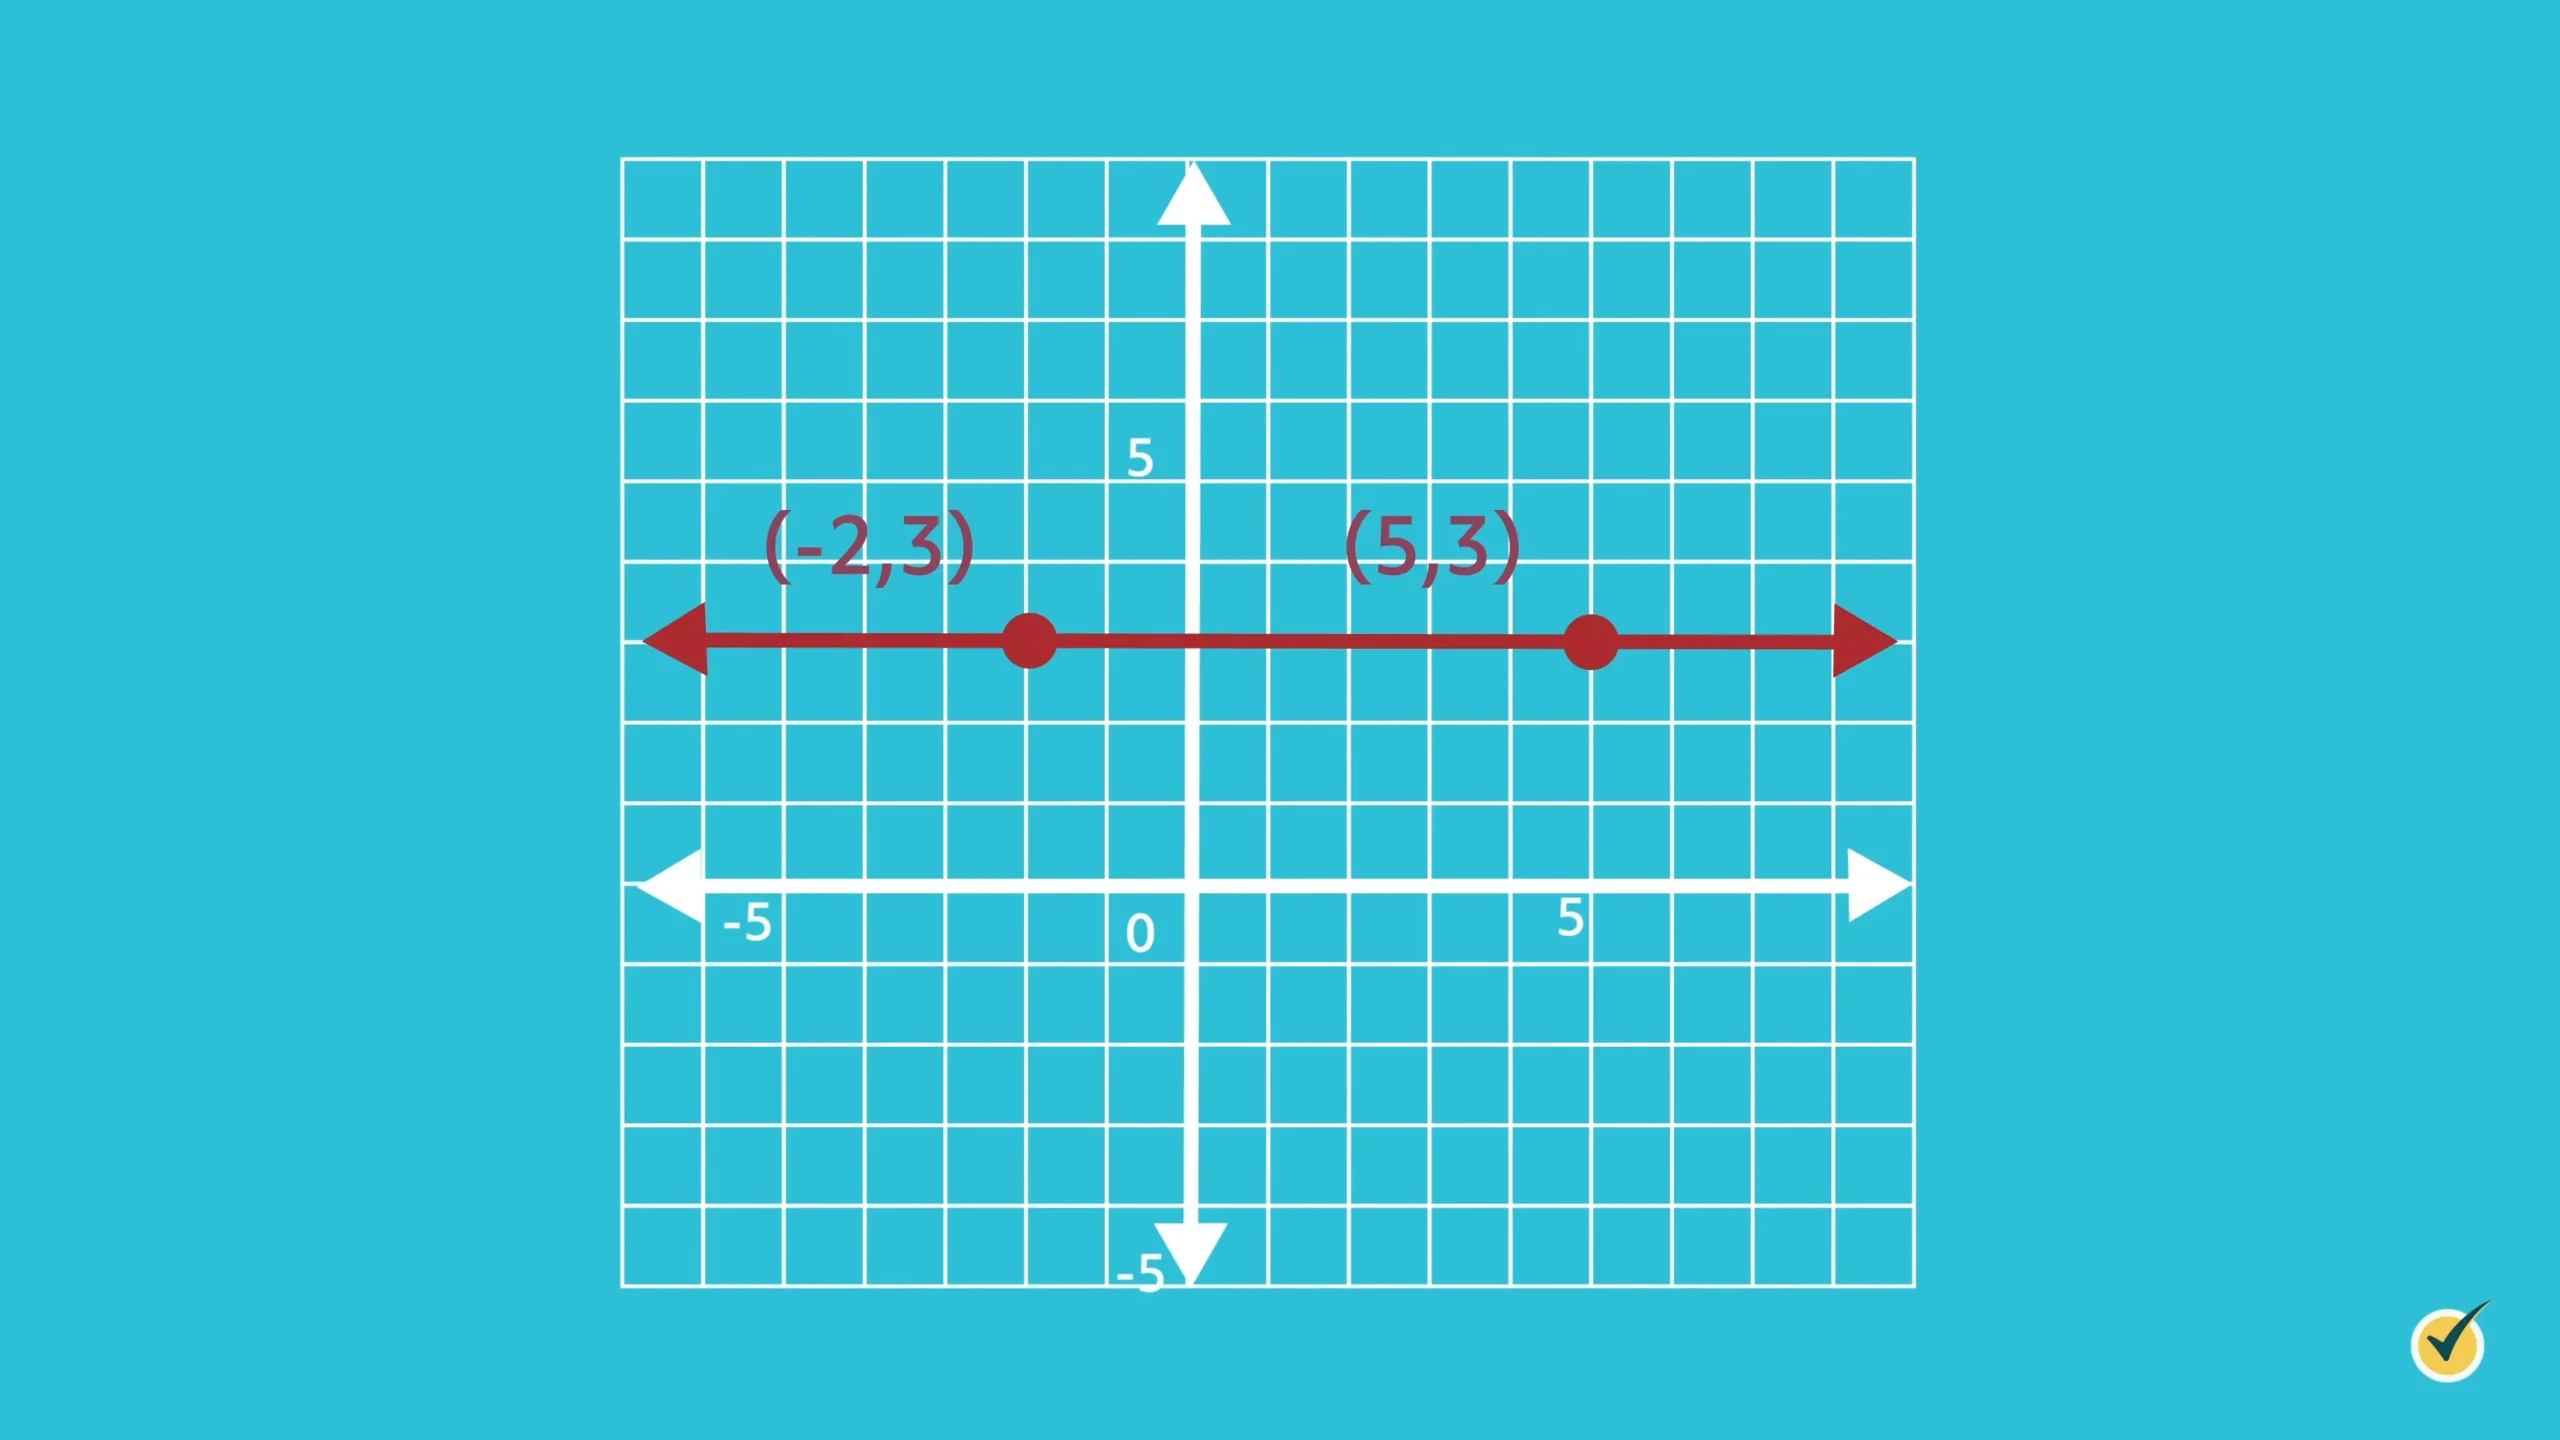
Calculate the slope of the line that travels through the points \((5,3)\) and \((-2,3)\).
This time, when we determine the vertical change, or the change in \(y\), we get an answer of \(3-3=0\).
Intuitively, this makes sense because there is no change in the \(y\)-coordinates from one point to the other. There is a change in \(x\); however, dividing 0 by any value results in 0.
The slope of this line is, therefore, \(\frac{0}{-2-5}=\frac{0}{-7}=0\).
This is true for any horizontal line that exists on the coordinate plane. These equations are written in the form \(y=c\), where \(c\) is any value on the \(y\)-axis. Accordingly, the line shown at right is \(y=3\).
Some people find it helpful to visualize a horizontal line with a slope that does not “rise” but “runs” forever.
With similar reasoning, let’s explore the nature of slope for points that lie on a vertical line.
Determine the slope for the line that passes through the points \((2,5)\) and \((2,-1)\).
Just by looking at these points, we see that there is no change in \(x\)-values, so the denominator of the slope calculation will be 0.
Slope for this line is be calculated as follows: \(\frac{-1-5}{2-2}=-60\).
You may remember that dividing by zero is “undefined.” Vertical lines are written in the form of \(x=c\), where \(c\) is any value on the \(x\)-axis. This line is written as \(x=2\).
Note that there is no slope for vertical lines, as they do not “slant” in either direction. These lines “rise” forever, but do not “run.”
Practice
For the following graphs, indicate whether the slope of the line is positive, negative, zero, or undefined.
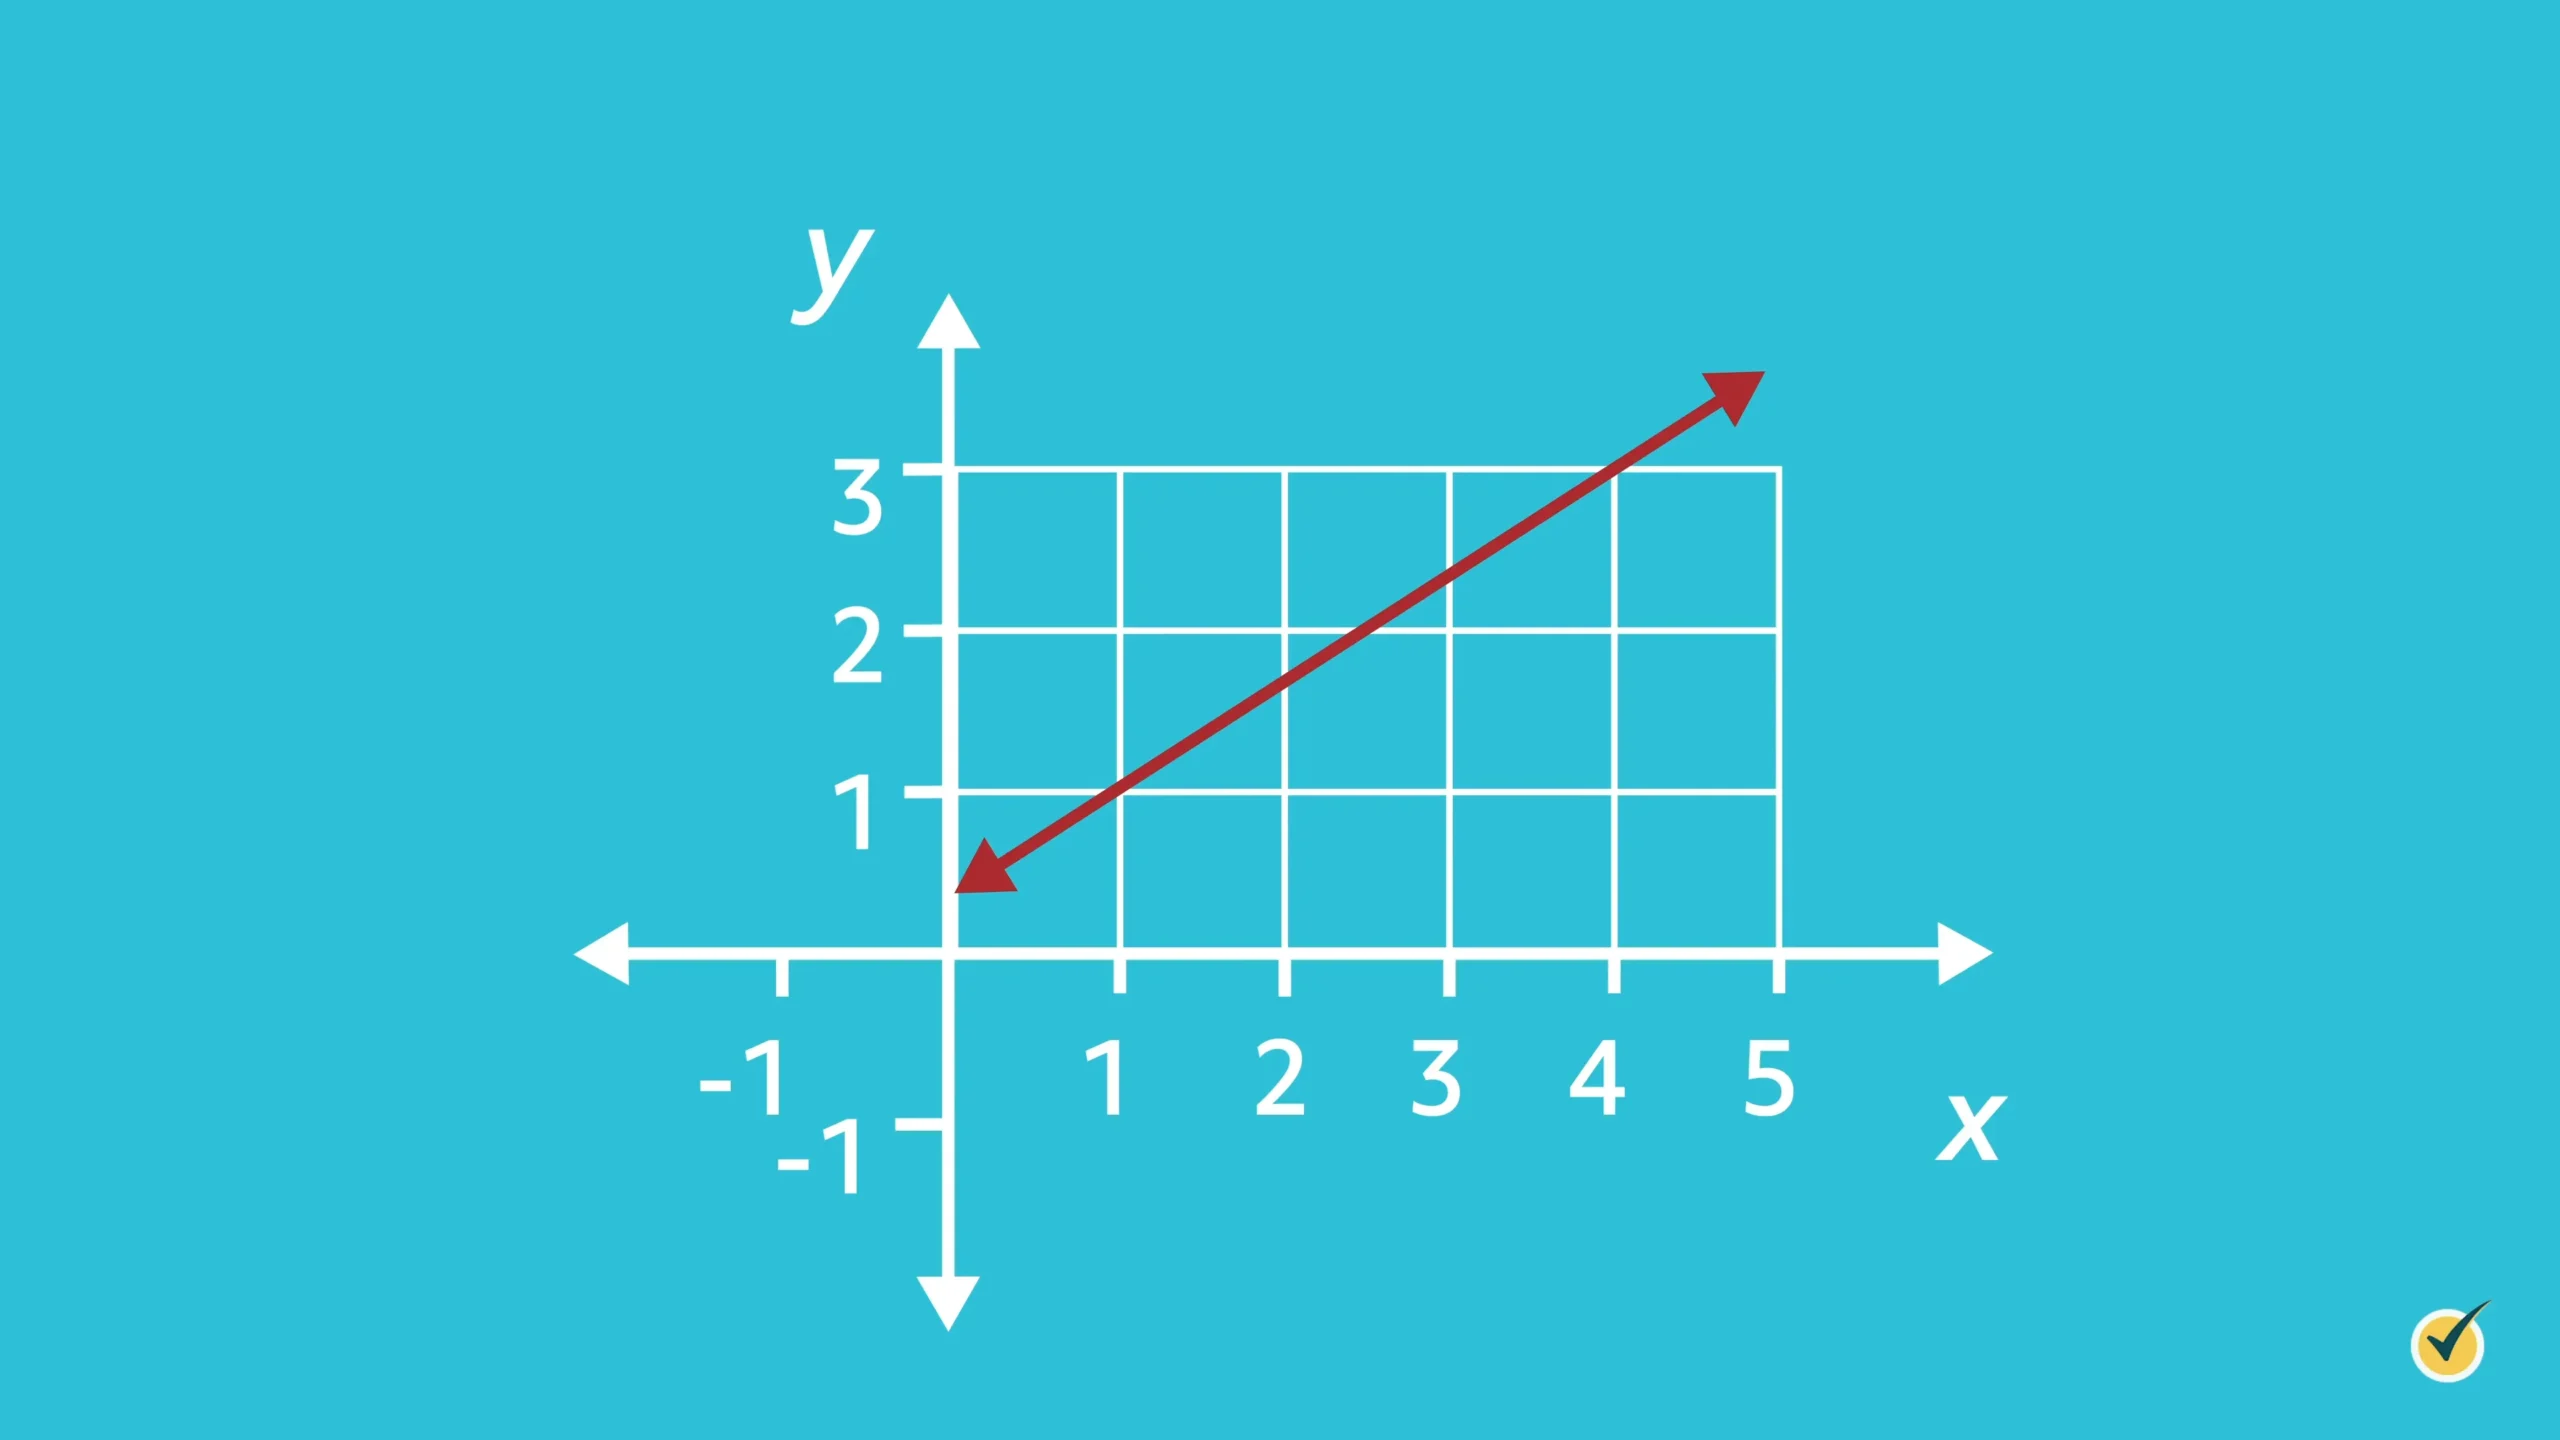
Example 1
Answer: Positive slope. The line slopes upward from left to right.
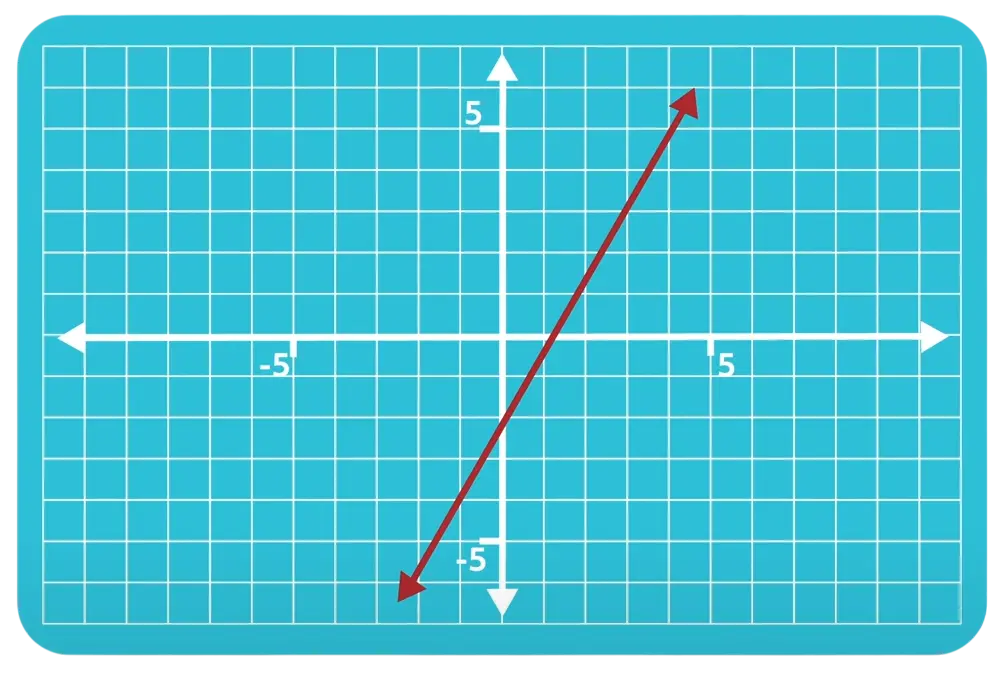
Example 2
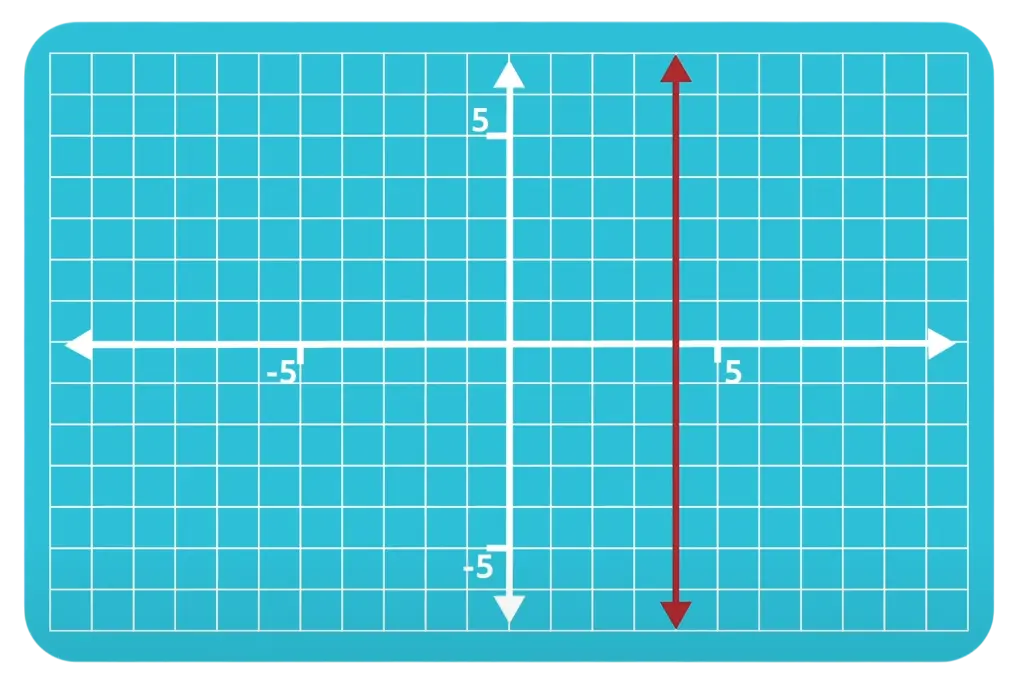
Answer: Slope is “undefined.” All vertical lines have undefined slope.
Example 3
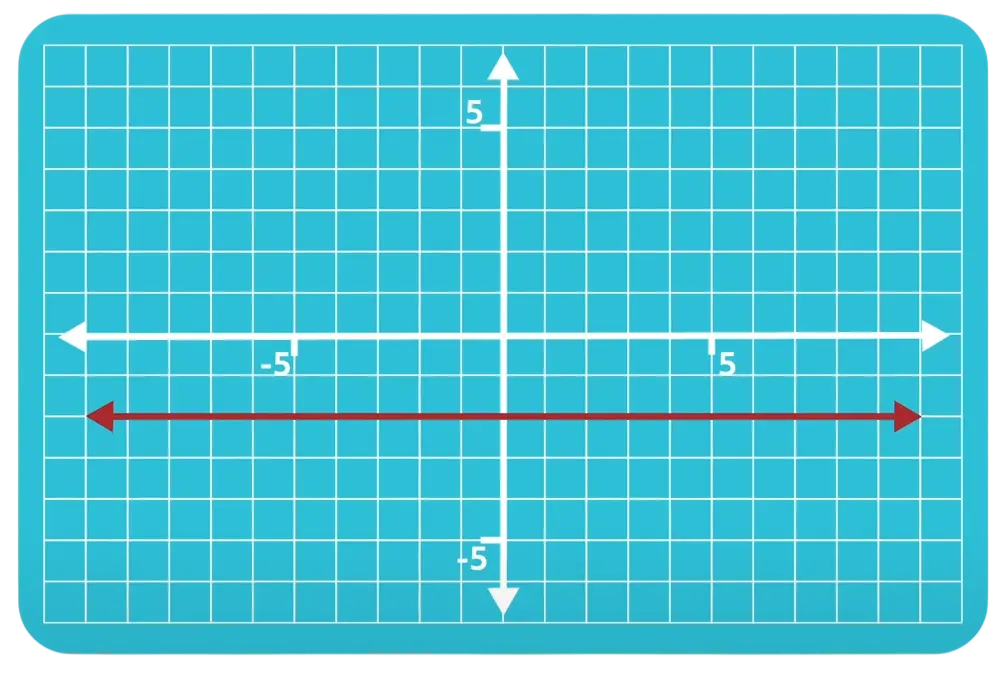
Answer: Slope is equal to 0. All horizontal lines have a slope equal to 0.
Example 4
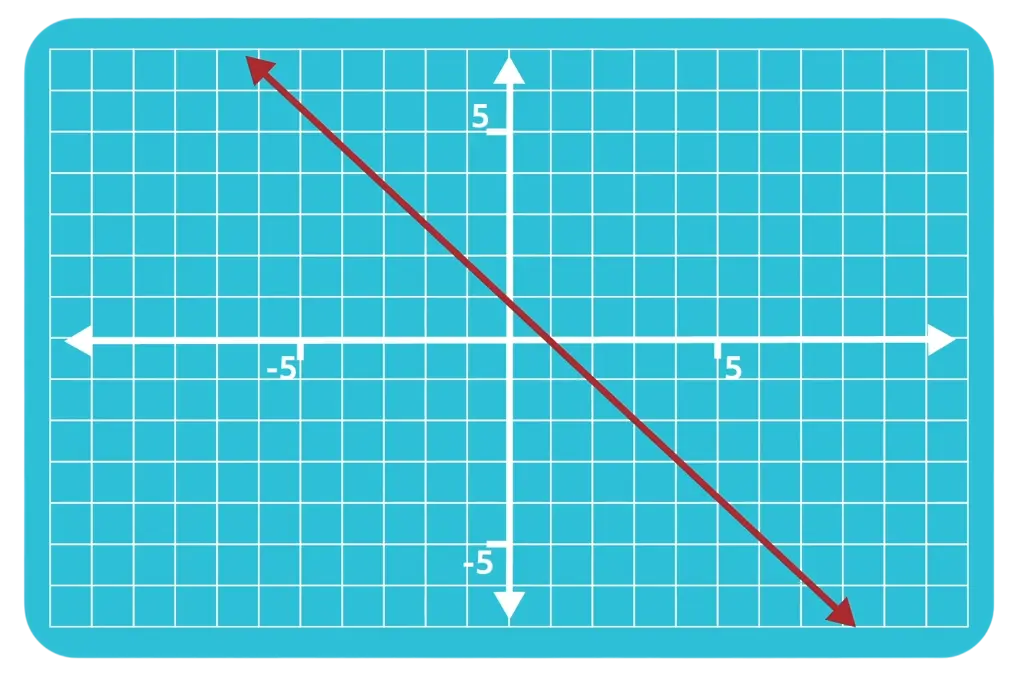
Answer: Slope is negative. The line slopes downward from left to right.
The y-Intercept
When graphing a linear function, the slope is extremely important. If we have one point and our slope, we can find every other point on the line and see what the line looks like. We just learned that in our slope-intercept form of our linear equation \(y=mx+b\), the letter \(m\) represents our slope.
Remember, the letters \(x\) and \(y\) represent the \(x\)-coordinate and \(y\)-coordinate of any point that satisfies our equation. Now the only thing left we have to talk about in our equation is the letter \(b\).
The letter \(b\) in our slope-intercept form represents the \(y\)-intercept of the equation. The \(y\)-intercept is the point where the graph hits the \(y\)-axis, or where \(x=0\). So the \(y\)-intercept gives us the point that we need to figure out our graph. The point will be \((0,b)\) for whatever number is in the \(b\) position.
Example #1
Let’s try an example.
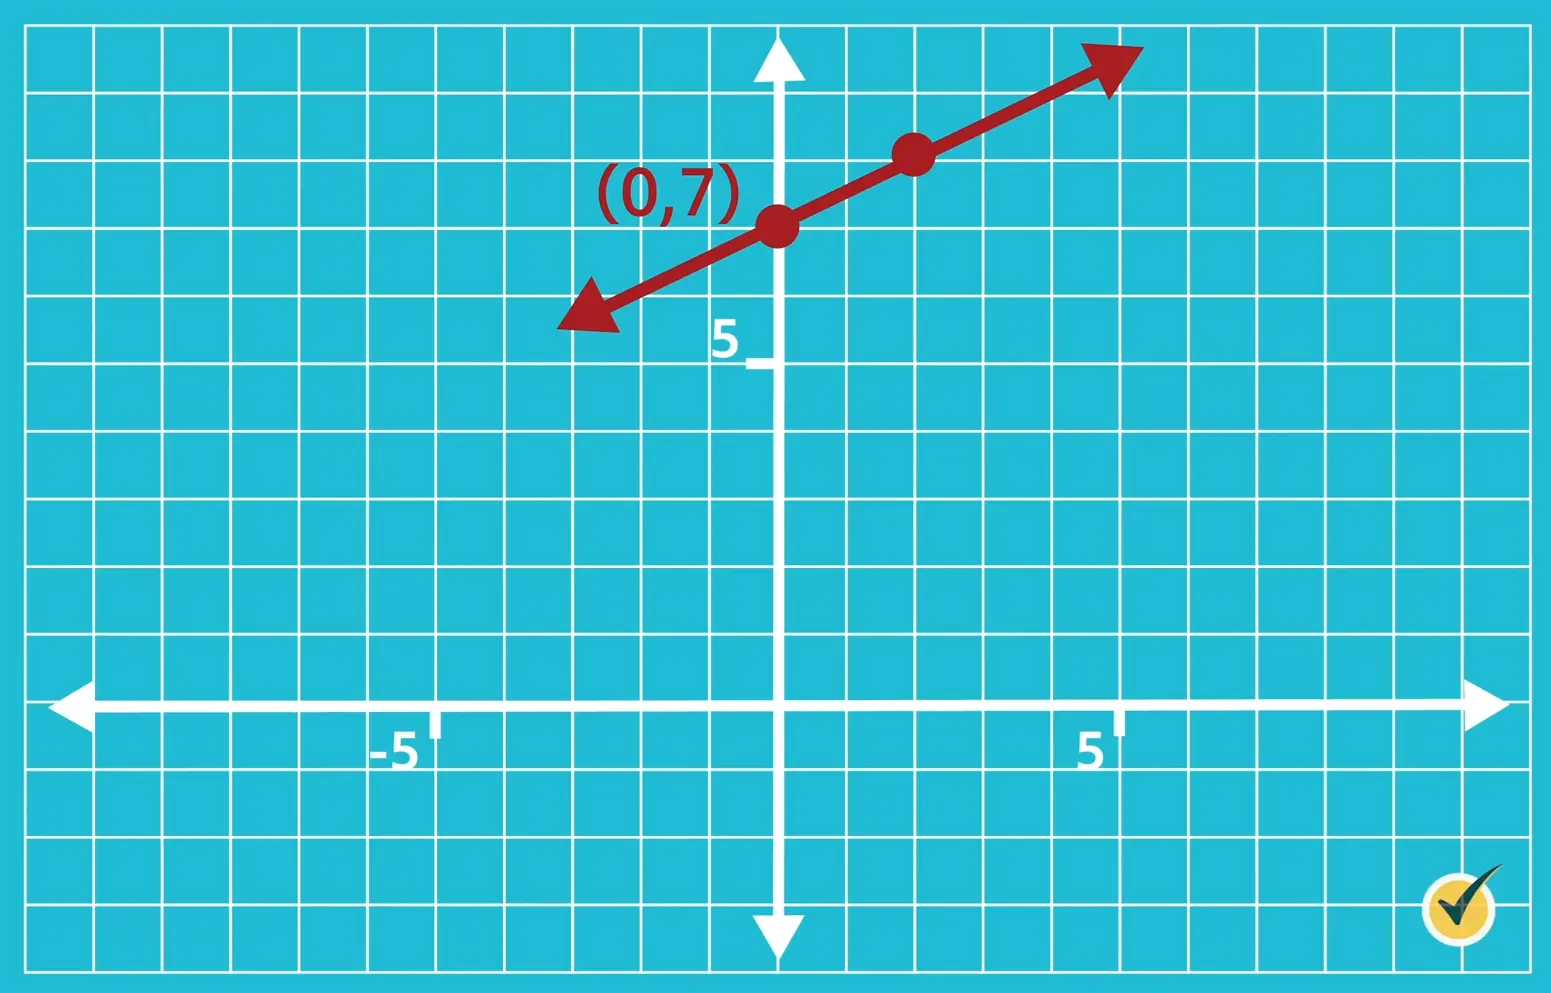
What is the slope and \(y\)-intercept of the equation \(y = x + 7\)?
Our slope is our \(m\)-value, so for this equation, slope is equal to \(\frac{1}{2}\).
We determine our \(y\)-intercept by looking at our \(b\)-value, which in this case is 7. Remember, this number gives us our \(y\)-coordinate for our point where \(x = 0\). So the \(y\)-intercept of this equation is \((0,7)\).
Now that we know how to identify our slope and \(y\)-intercept, let’s look at how we can use these two things to graph our equation.
- Our first step is to identify the \(y\)-intercept. For our equation above, we already did this. Our \(y\)-intercept is \((0,7)\).
- The second step is to plot that point on our graph. So we are going to place a point at \((0,7)\).
- Next, we want to look at our slope, which we found earlier to be \(\frac{1}{2}\). Remember, the slope is the ratio of our change in \(y\) over our change in \(x\), or our rise over run.
- Fourth, we are going to use our slope to find another point on the line. Start at the \(y\)-intercept and move up (or rise) one and move right (or run) two, and place another point here.
- Since we have two points, we can make a straight line. So our final step is to draw a straight line between the two points, making sure to put arrowheads on either end of the line to indicate that it continues forever in either direction.
It’s as simple as that!
Example #2
Let’s try another example following the steps we used before.
Graph the equation \(y = 2x -4\).
- Identify the \(y\)-intercept. Our \(b\)-value in this equation is negative, so our \(y\)-intercept is also going to be \((0, -4)\).
- Plot the \(y\)-intercept on the graph.
- Identify the slope. Remember, the slope is our \(m\)-value so in this case it is 2.
- Use the slope to plot a second point. When we are given a whole number, we can turn it into a fraction by placing it over 1. This doesn’t change the value of the number because any number divided by 1 is itself. So our slope now looks like \(\frac{2}{1}\). This means that from our \(y\)-intercept we are going to rise 2 values and run 1.
- Draw a line between the two points.
Example #3
I want you to try one more. This time, try to do it without my help.
Graph the line \(y = \frac{-2}{3x} +1\).
Think you’ve got it? Let’s walk through it together.
Our \(y\)-intercept is at the point \((0,1)\) so we are going to plot that first.
Now we look at our slope. This tells us that we are going to go over 3 places and down 2. We go down instead of up because our slope is negative.
Now that we have our two points, we draw our line through them and add our arrowheads.
Before we go, I want to look at few more things about slope that are helpful to know.
Special Slope Relationships
There are two more very important types of lines that have special slope relationships. Consider the following graphs:
These lines have the special relationship of being equidistant, or parallel. That means that they are the same distance apart for each value on both the positive and negative sides of the \(x\)-axis. As we have discussed, the slope determines the “slant” of the line and, clearly, equidistant lines have the same slant.
In other words, parallel lines have the same slope.
The equations in slope-intercept form for these lines are \(y=\frac{2}{3}x-1\) and \(y=\frac{2}{3}x+2\).
The slope is clearly identifiable in both equations. If given two equations, the lines are parallel if the slopes are the same.
This graph shows two lines that have the special feature of intersecting at a right angle. As a result, these lines are considered perpendicular.
The equations for these lines are \(y=3x-1\) and \(y= \frac{-1}{3}x-2\).
Again, there seems to be a relationship between the slopes, \(m=3\) and \(m= \frac{-1}{3}\). Any guesses?
Well, there are actually two distinct differences between these slope values.
The signs are opposite: the slope of one line is positive and the slope of the other is negative. The slope values are reciprocals, meaning that the numerator and denominator are “flipped.”
If these two changes are recognized in the slopes of two linear equations, then the lines that they represent are perpendicular.
Let’s apply this information with some practice. See if you can answer these on your own:
Example #1
What is the slope of a line that is parallel to \(y=\frac{5}{7}x-2\)?
Answer: The slope of this parallel line is equal to \(\frac{5}{7}\). Remember, parallel lines have equal slope.
Example #2
What is the slope of a line that is perpendicular to \(y=\frac{2}{5}x+1\)
Answer: The slope of this perpendicular line is equal to \(\frac{-5}{2}\). Remember, perpendicular lines have slopes that are opposite reciprocals.
Example #3
State whether the lines are parallel, perpendicular, or neither:
\(y=3x+4\) and \(y= \frac{-1}{3}x-8\)
Answer: Perpendicular. The slopes are opposite reciprocals.
Example #4
\(y= -x+5\) and \(y=\frac{1}{2}x+2\)
Answer: Neither.
Slopes are not the same and slopes are not opposite reciprocals. These lines intersect but NOT at a right angle.
Example #5
And one more:
\(y=x+2\) and \(y=x-5\)
Answer: Parallel. Slopes are both equal to 1.
I hope I’ve cleared up any confusion that you may have had with regard to slope and graphing linear equations. As you can see, slope is the driving force in graphing and holds the key to identifying special relationships between lines.
That’s all for this review! Thanks for watching, and happy studying!
How to Graph a Function Practice Questions
Which line is parallel to the line that passes through the points \((3,-1)\) and \((-2,4)\)?
Since parallel lines have the same slope, the first step is to find the slope of the line that goes through the points \((3,-1)\) and \((-2,4)\).
The slope formula is:
\(\dfrac{\text{Change in } y}{\text{Change in } x}\)
Change in \(y\) is \(4-(-1)=5\), and the change in \(x\) is \(-2-3=-5\).
Therefore, the slope of the line that passes through the points is \(\frac{5}{-5}=-1\) and the slope of the line \(y=-x–5\) is also −1.
Which is true about the slope of the line that goes through the points \((-2,3)\) and \((4,3)\)?
The graph of a horizontal line has a zero slope.
There are two ways to find the solution to this problem. The first way is to graph the line, which produces a horizontal line, which will conclude that the slope is zero. The second way is to use the slope formula, which is:
\(\dfrac{\text{Change in } y}{\text{Change in } x}\)
The change in \(y\) is \(3-3=0\) and the change in \(x\) is \(4-(-2)=4+2=6\).
A fraction with a zero in the numerator is equal to zero, the slope of the line.
What is the slope and \(y\)-intercept of a line represented by the equation \(y=3x–9\)?
The equation of the line is written in slope-intercept form, which is \(y=mx+b\), where \(m\) is the slope and \(b\) is the \(y\)-intercept.
Therefore, the slope of the line is 3 and the \(y\)-intercept is −9.
Which equation represents the graph of the line below?
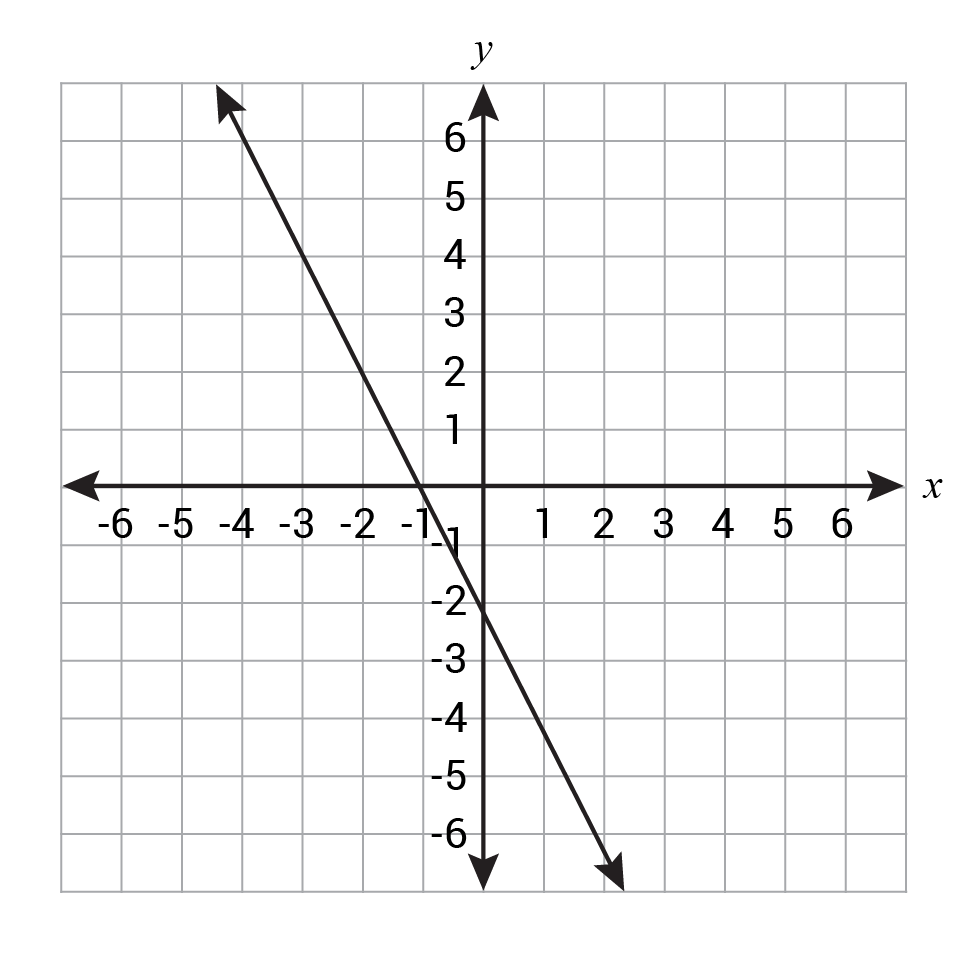
To find the slope of the line, we can use two points on the line and apply the slope formula, or we can count the rise and run on the graph between two points as shown below.
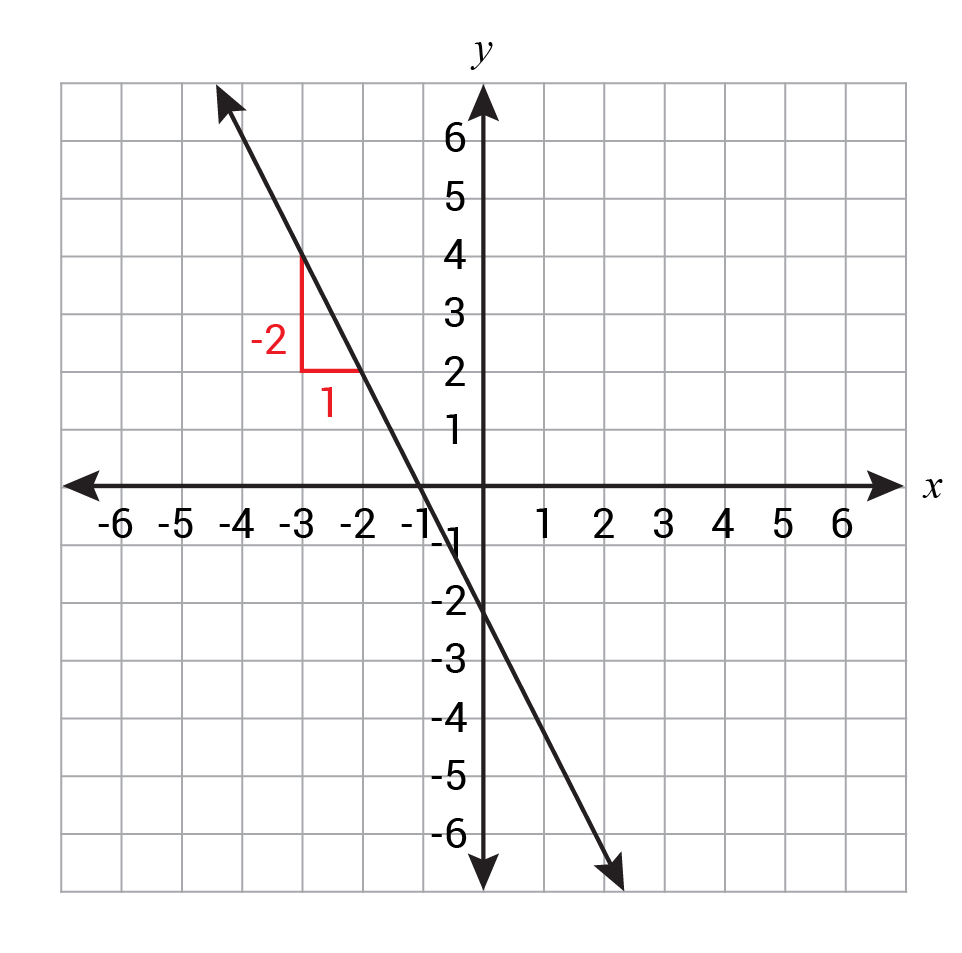
The line goes down 2 and right 1, meaning it has a slope of −2. To find the \(y\)-intercept of the line, we can either look at where the graph intersects the \(y\)-axis or substitute a point from the line into the slope-intercept form of the equation with the slope and solve for \(b\).
The line hits the \(y\)-axis at \(y=-2\), so the \(y\)-intercept is −2.
The slope of a line is \(\frac{3}{5}\) and passes through the point \((0,-4)\). What is the equation of the line?
The equation of the line when written in slope-intercept form, \(y=mx+b\), shows the slope, \(m\), and \(y\)-intercept, \(b\).
The problem states that the slope is \(\frac{3}{5}\), and if we recall, a point where the \(x\)-value is 0 is on the \(y\)-axis. Therefore, if the line goes through the point \((0,-4)\), it must be the \(y\)-intercept of the line.