

Hello, and welcome to this video about stem-and-leaf plots! Today we’ll learn how to read a stem-and-leaf plot and discuss what sorts of information it’s used to display.
Reviewing the Basics
Before we get started, let’s review a few things. First, a data set is a collection of numbers that relate to a specific topic. For instance, class scores on a math test are a data set.
Mathematicians use graphs to illustrate data sets.
What is a Stem-and-Leaf Plot?
A stem-and-leaf plot is a type of graph that displays quantitative data.
Each data point in a stem-and-leaf plot gets broken down into 2 components: the stem and the leaf. The stem is the first digit, or digits, of the data value, and the leaf is its last digit. A stem-and-leaf plot looks like a table with 2 columns. The left column contains the data set’s stems, and the right column contains its leaves.
Stem-and-Leaf Plot Examples
Example #1
Let’s look at an example of a stem-and-leaf plot together:
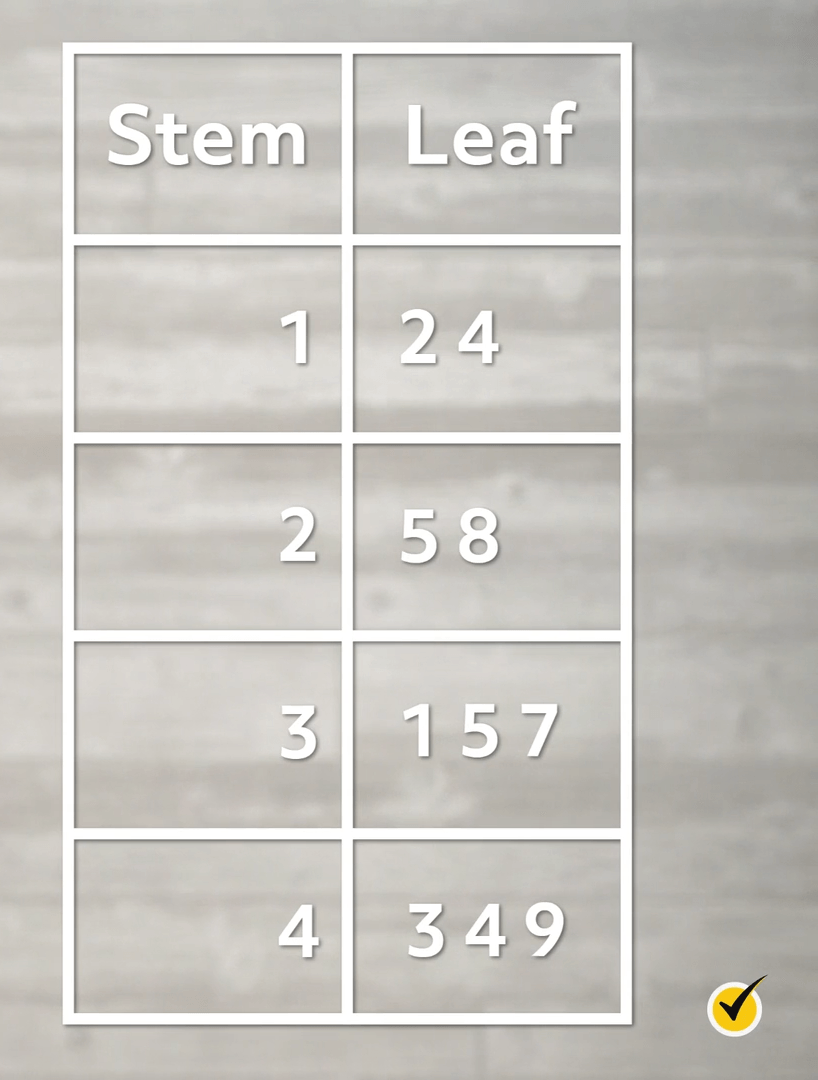
In the table above, the stem column shows the tens place for numbers that appear in the data set. The leaf column shows the ones place for each data value.
The data values with 1 in the tens place are 12 and 14. The data values with 2 in the tens place are 25 and 28. The data values with 3 in the tens place are 31, 35, and 37. The data values with 4 in the tens place are 43, 44, and 49.
Stem and leaf plots are a useful way to organize quantitative data. We can interpret a stem-and-leaf plot to answer questions about the data set. Let’s say that in this stem-and-leaf plot, each number is the age of a family member.
Given this context, we can answer questions about the data set using the stem-and-leaf plot. For instance, if I asked how many family members are in their 40s, you can see that 3 data values have 4 as their stem. Therefore, 3 family members are in their 40s. Understanding how to read and interpret stem-and-leaf plots helps us interpret data.
Example #2
Let’s look at another stem-and-leaf plot together.
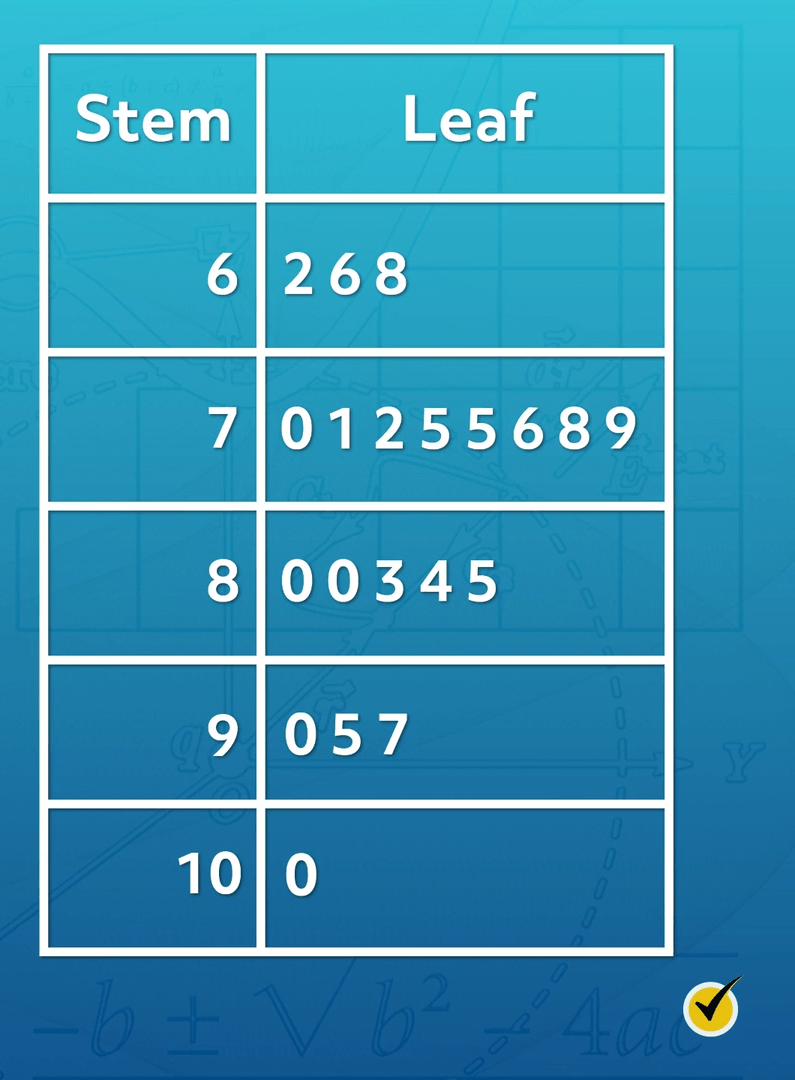
This stem-and-leaf plot shows student test scores on a math assessment. Now that we know how to read stem-and-leaf plots, let’s see if we can answer a few questions about the data set.
1. What was the lowest score earned on the assessment?
The lowest score earned on the assessment is 62%. Recall that the stem columns show the first digit, or digits, of the data value. The lowest stem shown is 6, so the lowest test score is in the sixties. Each leaf shows the ones place value of each number in the data set. The lowest leaf with a stem of 6 is 2, so the lowest score in the data set is 62%.
2. How many students earned a score of 80% or higher?
To answer this question, we need to count how many numbers have a stem of 8, 9, or 10. Since there are 5 leaves shown for a stem of 8, there are 5 test scores in the 80s: 80, 80, 83, 84, and 85. Since there are 3 leaves shown for a stem of 9, there are 3 test scores in the 90s: 90, 95, and 97. There is 1 leaf shown for a stem of 10, so the test score is 100%. Adding these together, 9 students earned a score of 80% or higher on the math test.
3. How many students took the math assessment altogether?
To figure out how many students took the math assessment, we need to count how many pieces of data we have in this data set. Looking at the leaves listed for each stem, we can count how many test scores occur in each frequency. \(3+8+5+3+1=20\), so there are 20 test scores altogether. Therefore, 20 students took the math assessment.
Example #3
Now it’s your turn. The stem-and-leaf plot shows the average temperatures in Philadelphia from the last 14 days. All temperatures are recorded in degrees Fahrenheit. Use the stem-and-leaf plot to answer the following questions:
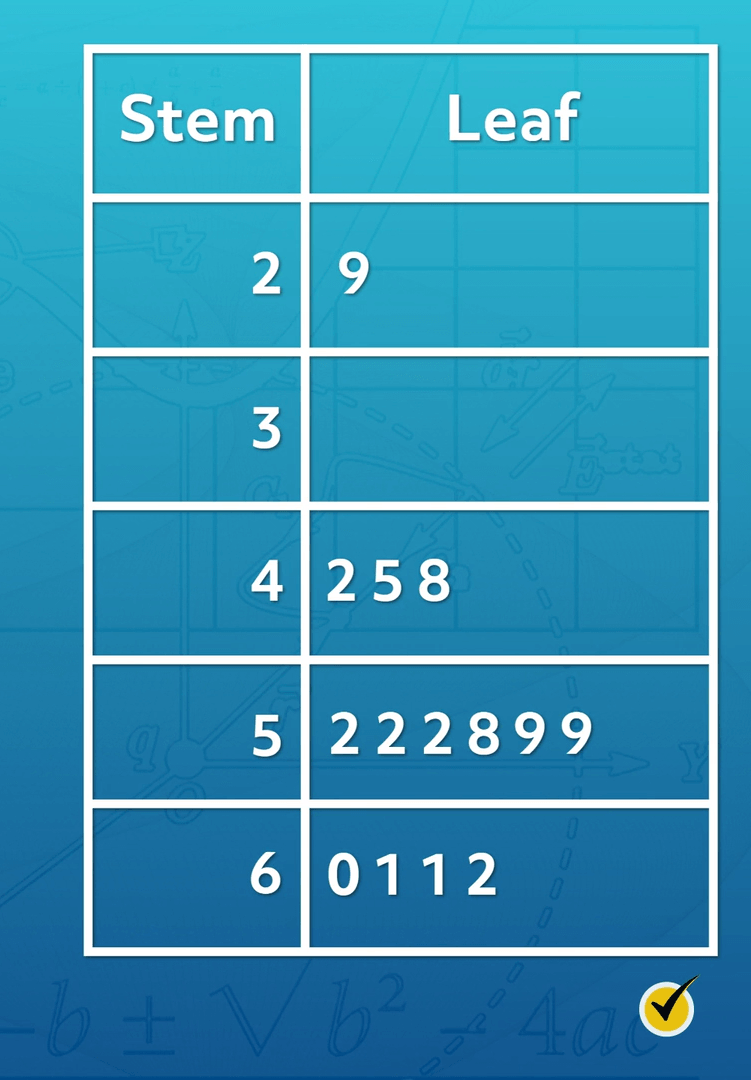
1. What is the maximum temperature recorded?
2. What is the most repeated temperature in Philadelphia over the last 14 days?
3. How many days recorded a temperature greater than 30 degrees but less than 40 degrees?
Pause the video, and analyze the stem-and-leaf plot, and see if you can answer these questions yourself. When you’re ready, resume the video, and we’ll go over the answers together.
Now that you’ve tried these problems yourself, let’s go over them together.
1. What is the maximum temperature recorded?
To find the maximum temperature, look at the largest stem value, which is 6. Temperatures recorded in the sixties are 60, 61, 61, and 62. Therefore, the maximum temperature recorded is 62 degrees Fahrenheit.
2. What is the most repeated temperature in Philadelphia over the last 14 days?
The number that occurs most often in a data set is also called the mode. To find the mode, look for repeated leaf numbers for each stem. Looking at the leaves for a stem of 5, we see the number 2 recorded 3 times. Since no other leaf number repeats itself 3 or more times, this number is the mode. With a stem of 5 and a leaf of 2, the data value is 52. Therefore, the most repeated temperature in Philadelphia over the last 14 days is 52 degrees Fahrenheit.
3. How many days recorded a temperature greater than 30 degrees but less than 40 degrees?
A number greater than 30 but less than 40 must be in the 30s. Therefore, it must have a stem of 3. Looking at the table shown, there are no digits in the leaf column for a stem of 3. In other words, no recorded temperatures were in the thirties. Therefore, no days recorded a temperature greater than 30 degrees but less than 40 degrees.
Great job!
Benefits to Using Stem-and-Leaf Plots
There are lots of benefits to displaying quantitative data with a stem-and-leaf plot. Unlike frequency tables and histograms, which also display quantitative data, stem-and-leaf plots give more information by providing the specific values in the data set.
Additionally, they’re easy to read and understand. Just by glancing at a stem-and-leaf plot, you can determine if there are any strong outliers in the data set. In the last stem-and-leaf plot, 29 degrees was a clear outlier because there were no other temperatures close to that data value.
Stem and leaf plots are also helpful because they show the shape of the data distribution. Similar to bar graphs, stem-and-leaf plots make it easy to see the symmetry, peaks, and uniformity of a data set. Instead of using bars, stem-and-leaf plots use actual numbers to illustrate the data distribution.
Example #4
Let’s look at a new stem-and-leaf plot, showing the height of students measured in centimeters.
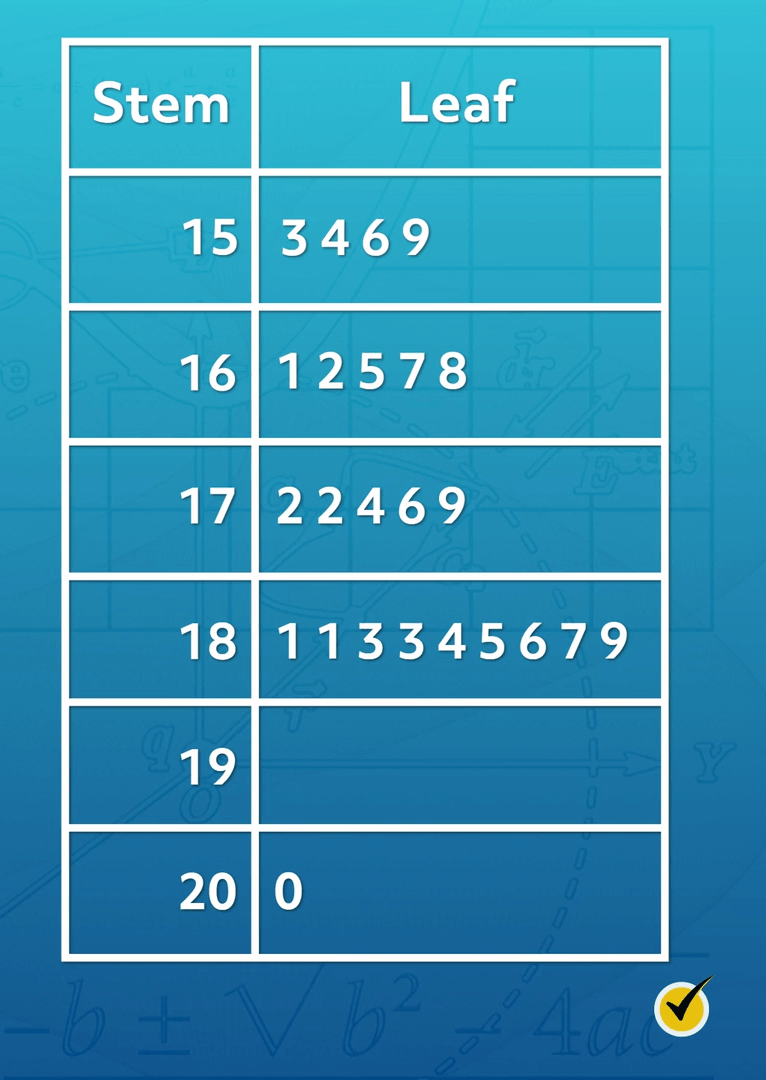
Notice that the stems all have 2 digits. This indicates that all data values are 3-digit numbers. Let’s use the stem-and-leaf plot to answer a few questions together.
1. Is this data set symmetrical? Explain.
Symmetry describes the shape of a data set. If the numbers are dispersed evenly, then the data set is said to be symmetrical. This particular data set is asymmetrical because most of its data values are in the 150s, 160s, 170s, and 180s. This data set is described as skewing to the right.
2. Are there any outliers in this data set?
An outlier is a number that is at an abnormal distance from other numbers in the data set. Since there are no data points close to 200, we can classify this number as an outlier.
3. How many students are taller than 180 centimeters?
To answer this question, we need to count how many numbers have a stem of 18, 19, or 20. Since there are 9 leaves shown for the stem of 18, 9 students are 180-something centimeters tall: 181, 181, 183, 183, 184, 185, 186, 187, and 189. Since there are no leaves shown for a stem of 19, there are no students with this height recorded. There is 1 leaf shown for a stem of 20, so the height of this student is 200 centimeters. Adding these together, 10 students are taller than 180 centimeters.
Example #5
I have one more stem-and-leaf plot for you to analyze on your own. This one is a little more challenging, but I know you can do it.
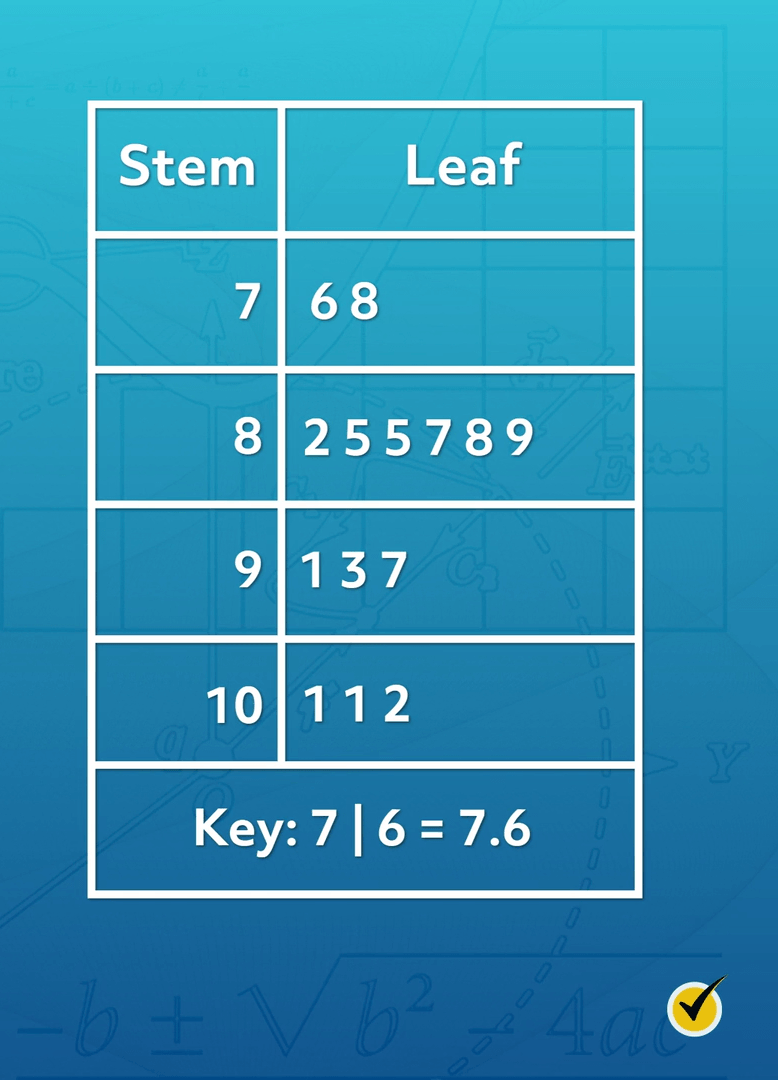
The average man jogs at a speed of 8.3 miles per hour. The following data set lists the average jogging speeds of all members of a men’s track team: 8.5, 8.5, 8.9, 8.8, 8.7, 9.1, 9.3, 9.7, 7.6, 7.8, 8.2, 10.1, 10.1, 10.2.
Answer the following questions about the data set, using the stem-and-leaf plot shown. Notice the key at the bottom, explaining how to interpret the stem-and-leaf plot using decimals in the tenths place.
1. Is this data set symmetrical? Explain.
2. How many members of the track team run faster than 8.3 miles per hour?
3. What are the maximum and minimum average jogging speeds on the track team?
Pause the video, and analyze the stem-and-leaf plot, and see if you can answer these questions yourself. When you’re ready, resume the video, and we’ll go over the answers together.
Now that you’ve tried these problems, let’s go over them together.
1. Is this data set symmetrical? Explain.
No. The data set is slightly asymmetrical, skewing right. Based on the number of leaves given for each stem, there are more data points with low values (7 to 8 seconds) than high values (9 to 10 seconds).
2. How many members of the track team run faster than 8.3 miles per hour?
To answer this question, we need to examine data values with a stem of 8, 9, or 10. For the data values with a stem of 8, count the leaves greater than 3 for jogging speeds greater than 8.3. 5 numbers are greater than 8.3: 8.5, 8.5, 8.7, 8.8, and 8.9. 3 numbers have a stem of 9: 9.1, 9.3, and 9.7. 3 numbers have a stem of 10: 10.1, 10.1, and 10.2. Adding these together, 11 members of the track team run faster than 8.3 miles per hour.
3. What are the maximum and minimum average jogging speeds on the track team?
The maximum average jogging speed is the fastest speed recorded, which is 10.2 miles per hour. The minimum average jogging speed is the slowest speed recorded, which is 7.6 miles per hour.
Great job!
I hope this video about stem-and-leaf plots was helpful. Thanks for watching, and happy studying!
Stem and Leaf Plot Practice Questions
| Stem | Leaf |
|---|---|
| \(3\) | \(1,4,5\) |
| \(4\) | \(0,2,2,2,3,4,5,6\) |
| \(5\) | \(1,1,3,7\) |
| \(6\) | \(5,8\) |
What is the mode for the set of numbers?
Each number in the set is a two-digit number, the stem is the first digit, or the tens place value in this case, and the leaf is the second digit, or the ones place value, of each number. The number that occurs most often in the set is called the mode of the set of numbers. To find the mode, look for any of the leaf portions of the numbers that are repeated for each stem. The leaf of 1 is repeated twice for the stem of 5, but the leaf of 2 is repeated three times for the stem of 4. The mode for the set of numbers is the most repeated number of 42.
| Stem | Leaf |
|---|---|
| \(3\) | \(1,4,5\) |
| \(4\) | \(0,2,2,2,3,4,5,6\) |
| \(5\) | \(1,1,3,7\) |
| \(6\) | \(5,8\) |
How many of the numbers in the set are greater than 43?
In this example, each number in the set is a two-digit number, the stem is the first digit, or the tens place value, and the leaf is the second digit, or the ones place value, of each number.
Since we want to know how many numbers in the set are greater than 43, we need to look at the numbers that have a stem of 4, 5, and 6. For the numbers that have a stem of 4, count the leaves that are greater than 3 to see how many of them are greater than 43. Three numbers are greater than 43 in this stem: 44, 45, and 46. There are four numbers that are contained in the stem of 5: 51, 51, 53, 57, and two numbers that are in the stem of 6: 65 and 68.
This gives us a total of \(3+4+2=9\) numbers in the set that are greater than \(43\).
| Stem | Leaf |
|---|---|
| \(25\) | \(0,2,3,4,4,7\) |
| \(26\) | \(1,1,2,3,4,5,5,7,8\) |
| \(27\) | \(1,5,6,6,9\) |
| \(28\) | \(0,2,3\) |
| \(29\) | \(1\) |
| \(30\) | \(5\) |
Which of the following statements best describes the symmetry of the data in the data set?
Symmetry describes the shape of a set of data. A set of data is said to be symmetrical when the values on the left and right side of the mean mirror each other.
The data values in our set contain stems that all have two-digits, and each has a corresponding leaf that contains one digit. This tells us that all the data values are three-digit numbers. Most of the data values (20 out of 25 of them) in the set are contained in the 250s, 260s, and 270s. There are fewer values in the higher range. So, the data is said to be asymmetrical and can be described as skewing to the right.
| Stem | Leaf |
|---|---|
| \(4\) | \(2,5\) |
| \(5\) | \(3,5\) |
| \(6\) | \(1,2,6,7,7\) |
| \(7\) | \(2,5,5,7,7,8,9\) |
| \(8\) | \(0,0,2,4,5,5,5,8,8\) |
| \(9\) | \(0,2,3,5,8\) |
| \(10\) | \(0,5\) |
What were the minimum and maximum test scores for the test?
The stems containing the digits 4 through 9 are two-digit numbers, where the stem is first digit or the tens place value, and the leaf is the second digit, or the ones place value, of each test score. The stem of 10 is a three-digit number where the stem is the first two digits of the test score, and the leaf is the third digit of the test score.
To find the minimum test score, look at the smallest stem value, which is 4. The test scores contained in this stem are 42 and 45. Therefore, the minimum test score was 42.
To find the maximum test score, look at the largest stem value, which is 10. The test scores contained in this stem are 100 and 105. Therefore, the maximum test score was a 105 (a perfect score of 100 plus the five bonus points).
The heights of an 8th grade math class of 25 students are taken in centimeters. The heights are recorded on the stem-and-leaf plot shown below.
| Stem | Leaf |
|---|---|
| \(12\) | \(5,9\) |
| \(13\) | \(4,5,6,6\) |
| \(14\) | \(1,3,4,6,6,8,8,8\) |
| \(15\) | \(0,4,5,7,8,9\) |
| \(16\) | \(0,1,2\) |
| \(17\) | \(0,2\) |
How many students’ heights are below the mode of heights of the class?
First, we need to find the mode. Each student’s height is a three-digit number, the stem contains the first two digits, and the leaf is the third digit of each student’s height. The number that occurs most often in the set is called the mode of the set of numbers. To find it, look for any of the leaf portions of the numbers that are repeated for each stem. The leaf of 6 is repeated twice for the stem of 13. The leaf of 6 is also repeated twice for the stem of 14. However, the leaf of 8 is repeated three times for the stem of 14. Therefore, the mode for the heights of the students is the most repeated height of 148 cm.
Since we want to know how many students’ heights are less than the mode of 148 cm, we need to look at the heights that have a stem of 12, 13, and 14. For the heights that have a stem of 14, count the leaves that are less than 8 to see how many of them are less than 148. Five student heights are less than 148 in this stem: 141, 143, 144, 146, and 146. There are four student heights that are contained in the stem of 13: 134, 135, 136, and 136. There are two student heights that are in the stem of 12: 125 and 129.
This gives us a total of \(5+4+2=11\) students’ heights that are less than 148 cm.