

Hello, and welcome to this video about pictographs! Today we’ll learn what pictographs are and how they’re used to interpret data.
Reviewing the Basics
Before we get started, let’s review a few things. First, a graph is a diagram that shows the relationship between two quantities.
Some graphs display quantitative data, which is numeric, and others display qualitative data, which is descriptive and conceptual.
What is a Pictograph?
A pictograph is a type of graph that shows qualitative data using images. All pictographs contain the following components:
- A title, which explains what the pictograph is about
- Categories or labels, which tell the type of data collected
- Symbols, which are images that represent a specific value
- A key, which explains the value of each symbol
Pictograph Examples
Example #1
Consider the pictograph shown. In this example, the title is, “Favorite Fruit of 6th Grade Students at West Middle School.” The categories are apples, bananas, strawberries, and grapes. The symbol, a star, represents the number of students who voted for a favorite fruit. At the bottom of the pictograph is a key, which tells us that 1 star represents 2 votes.
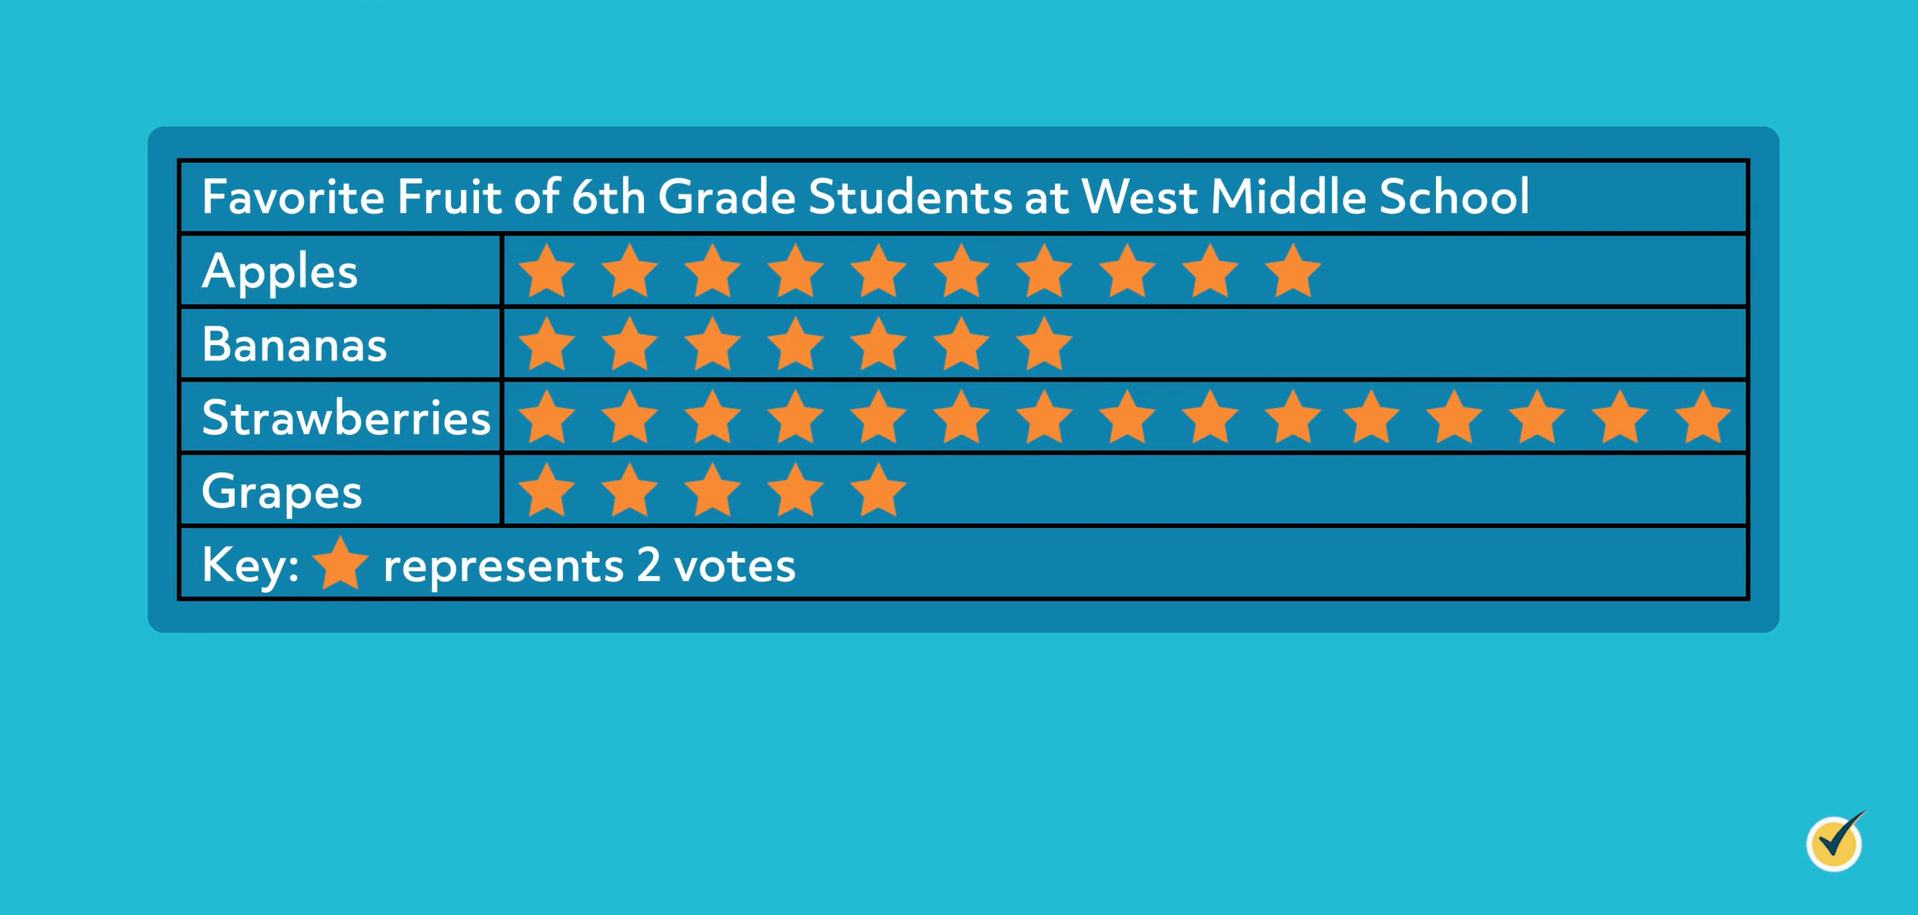
Mathematicians use pictographs to illustrate data gathered from a survey. In this case, the survey asked about the fruit preferences of students. For instance, we can see that the most popular fruit in this survey is strawberries. The least popular fruit is grapes. Since there are 7 stars next to bananas and each star represents 2 votes, 14 students voted for bananas. As you can see, understanding pictographs helps us interpret data.
Example #2
Let’s look at another example together.
Now that we know how to read a pictograph, let’s see if we can use the information to answer a few questions.
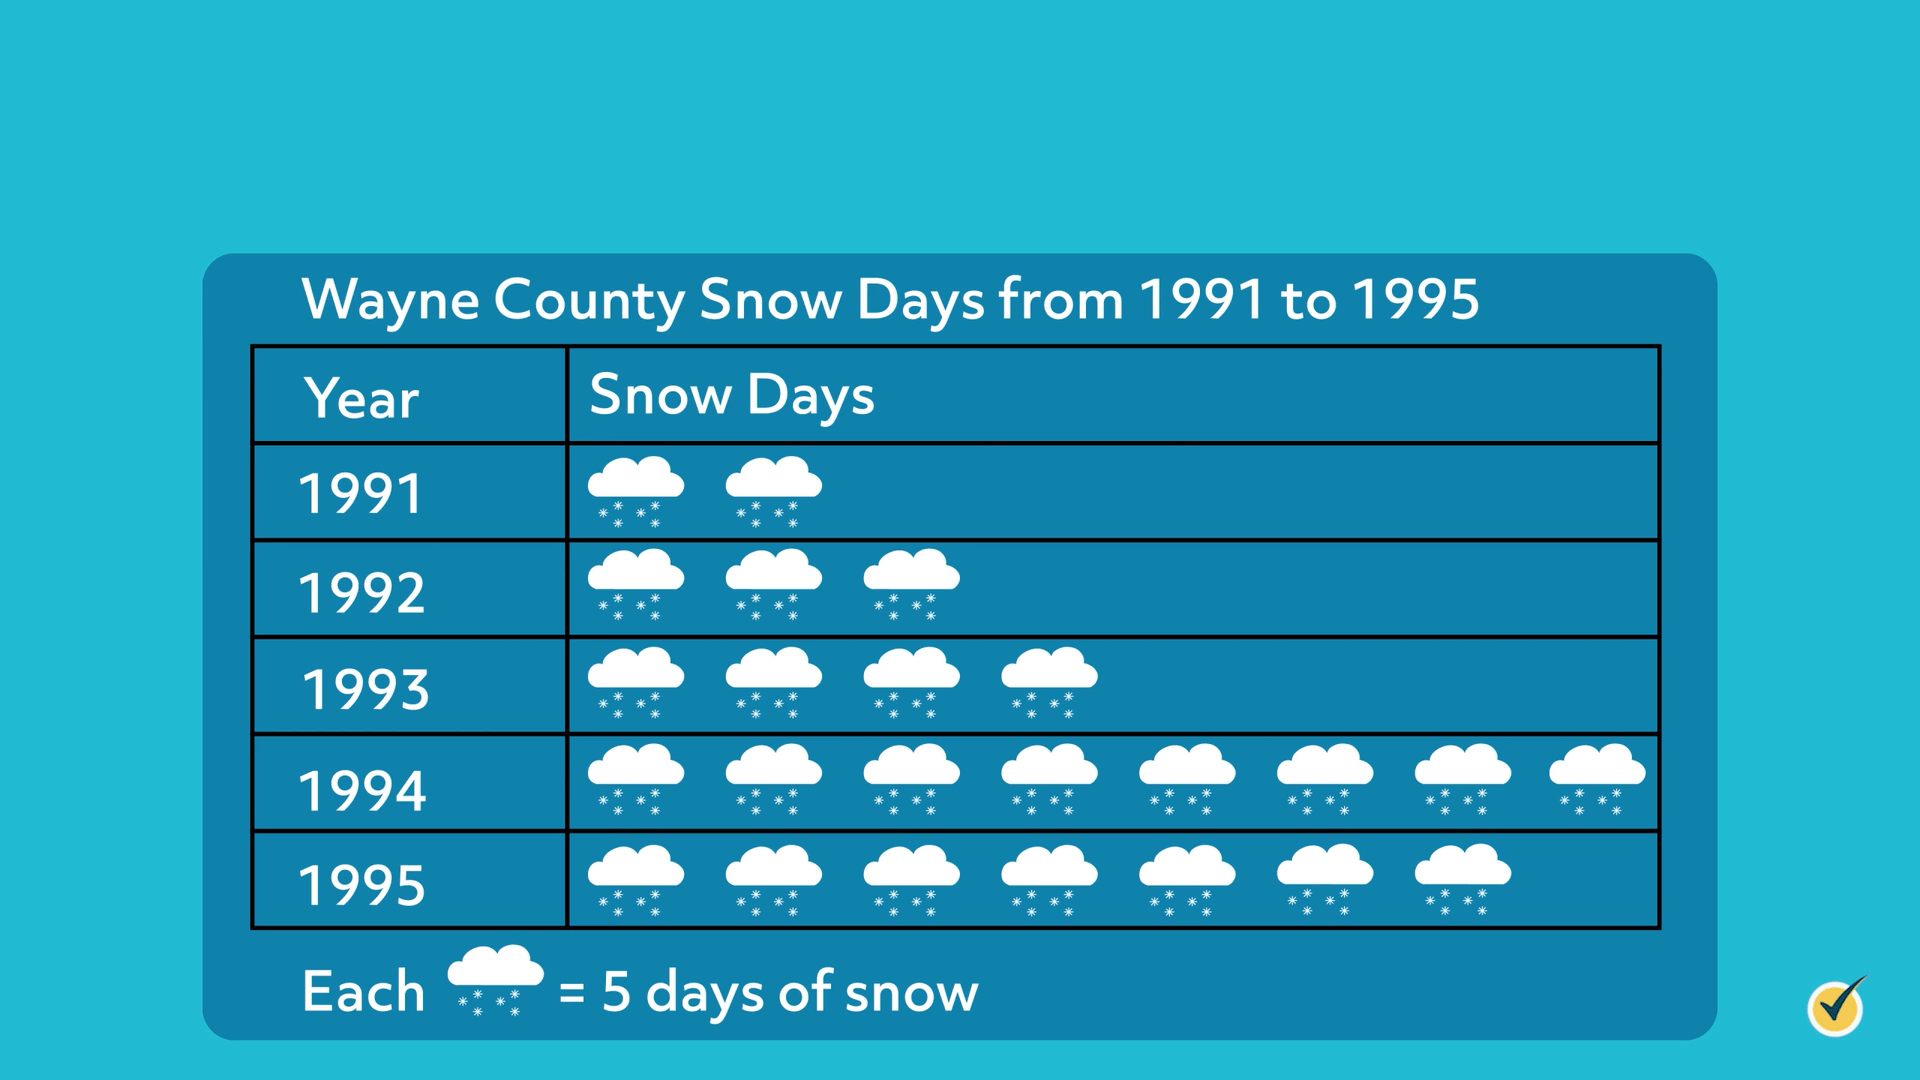
- How many days did it snow in 1993?
Start by looking at 1993 and count the number of symbols next to it, which is 4. Remember that we need to use the key to interpret the value of each symbol. According to the key, each symbol represents 5 snow days. Multiply 5 times the number of symbols given to find the total number of snow days. Since \(4\times{5} = 20\), there were 20 snow days in 1993.
- Which years saw less than 20 days of snow?
To answer this question, we need to figure out how many snow days each year had altogether. Remember that each symbol represents 5 snow days. We can multiply 5 times the number of symbols for each year to find the total amount of snow days for that year:
| 1991 | \(5\times{2}=10\) |
| 1992 | \(5\times{3}=15\) |
| 1993 | \(5\times{4}=20\) |
| 1994 | \(5\times{8}=40\) |
| 1995 | \(5\times{7}=35\) |
Based on our calculations, 1991 and 1992 saw less than 20 days of snow.
- What is the difference between snow days in 1994 and snow days in 1995?
For this question, we need to find the total number of snow days in 1994 and 1995 respectively and subtract.
| 1994 | \(5\times{8}=40\) |
| 1995 | \(5\times{7}=35\) |
1994 had 40 snow days, and 1995 had 35 snow days. To find the difference, subtract \(40-35=5\). The difference between snow days in 1994 and snow days in 1995 is 5.
Example #3
Now it’s your turn.
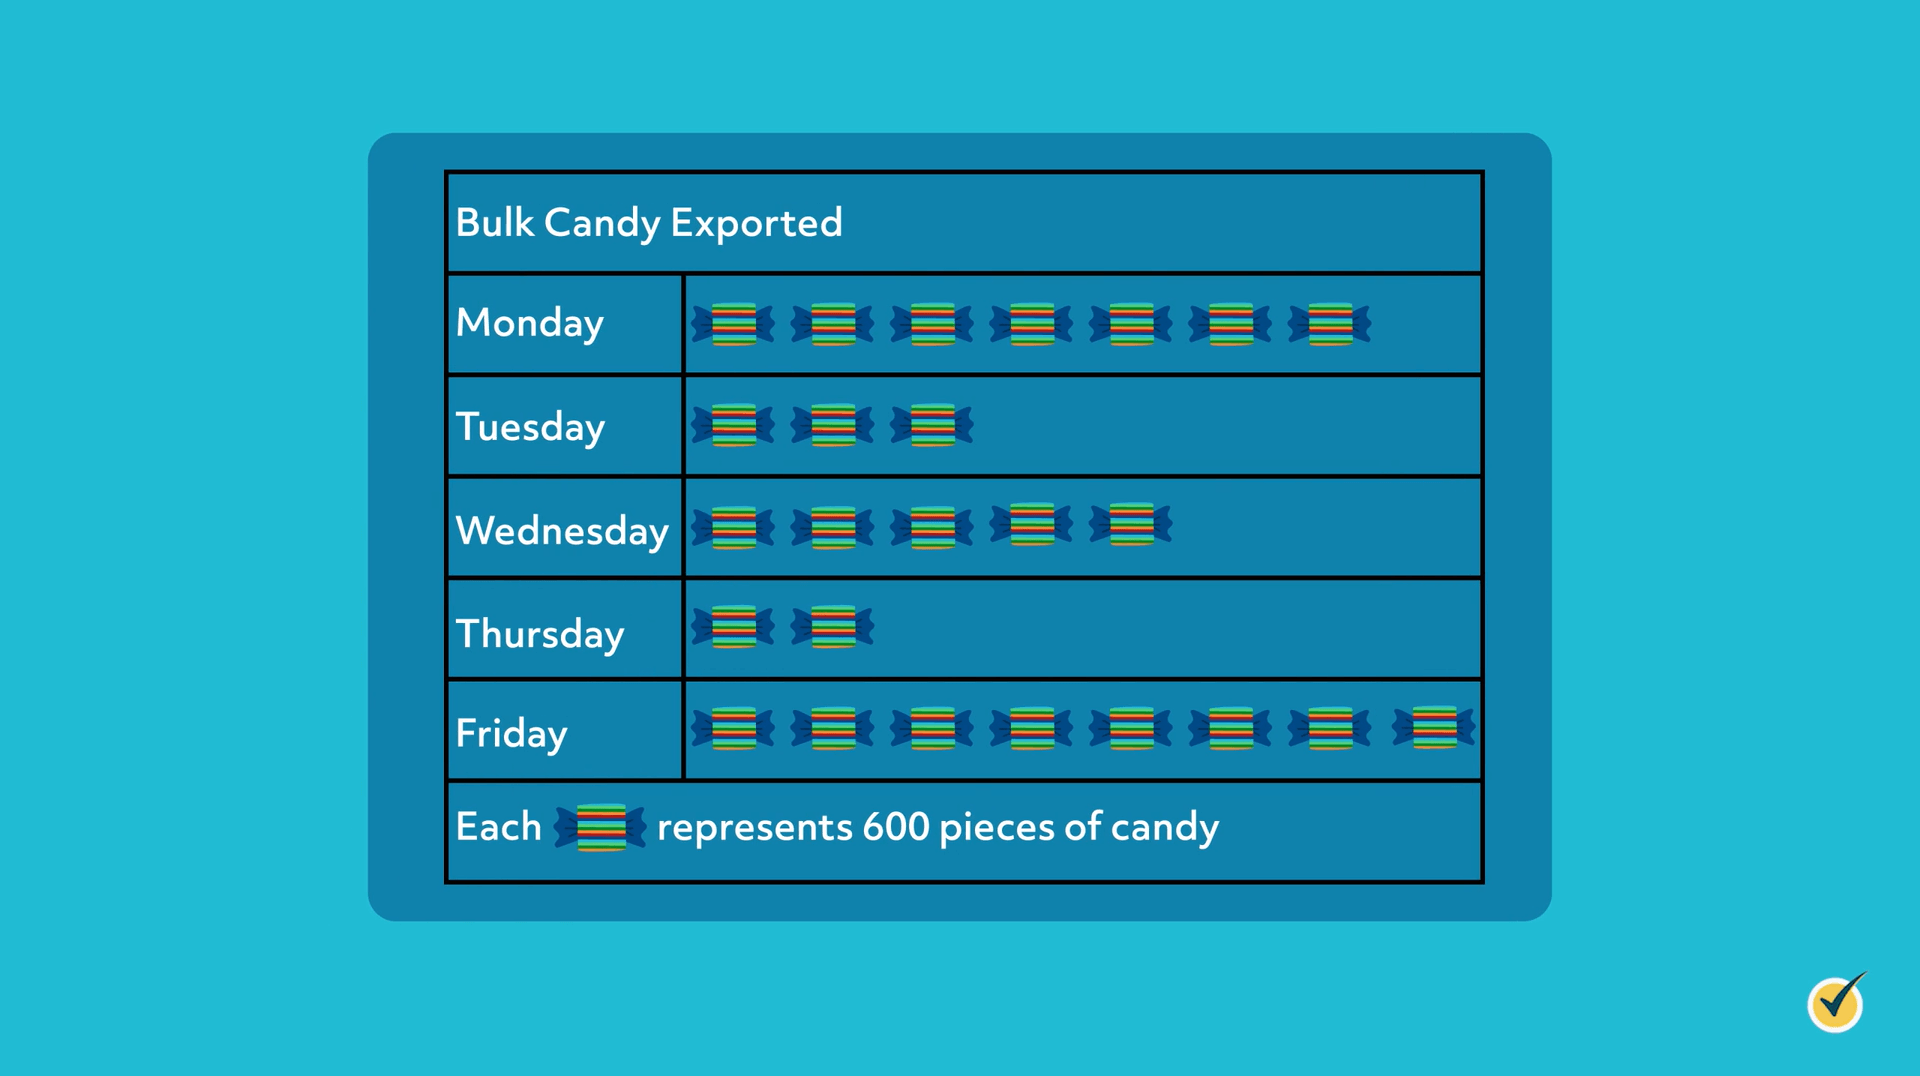
Sparkles Candy Factory exports bulk candy. The pictograph shows the amount of candy exported each day. Use the pictograph to answer the following questions:
- Which day exports the least amount of candy? How much gets exported on that day?
- How much more candy gets exported on Friday than on Monday?
- How much candy is exported on Tuesday and Wednesday altogether?
Pause the video, analyze the pictograph, and see if you can answer these questions yourself. When you’re ready, resume the video, and we’ll go over the answers together.
Now that you’ve tried these problems yourself, let’s go over them together.
- Which day exports the least amount of candy? How much gets exported on that day?
The least amount of candy gets exported on Thursday. We know this because it has the fewest symbols next to it. To figure out how much gets exported on Thursday, multiply the number of symbols by the amount it signifies. According to the key, each symbol represents 600 pieces of candy. Since there are 2 symbols next to Thursday, multiply \(600\times{2}\), which equals 1,200. Therefore, 1,200 pieces of candy get exported on Thursday.
- How much more candy gets exported on Friday than on Monday?
First, figure out how much candy gets exported on Fridays and Mondays. Remember that each symbol represents 600 pieces of candy. Since there are eight symbols next to Friday, multiply \(600\times{8}\), which equals 4,800. Since there are 7 symbols next to Monday, multiply \(600\times{7}\), which equals 4,200. To find out how much more candy gets exported on Friday, subtract to find the difference. \(4,800-4,200 = 600\). Therefore, 600 more pieces of candy get exported on Friday than on Monday.
- How much candy is exported on Tuesday and Wednesday altogether?
First, find the total amount of candy exported on Tuesday and Wednesday. Remember that each symbol represents 600 pieces of candy. Since there are 3 symbols next to Tuesday, multiply \(600\times{3}\), which equals 1,800. Since there are 5 symbols next to Wednesday, multiply \(600\times{5}\), which equals 3,000. To find the total amount exported on both days, add the Tuesday and Wednesday amounts. \(1,800 + 3,000 = 4,800\), so 4,800 pieces of candy are exported on Tuesday and Wednesday together.
Great job!
Example #4
Let’s look at a new pictograph together.
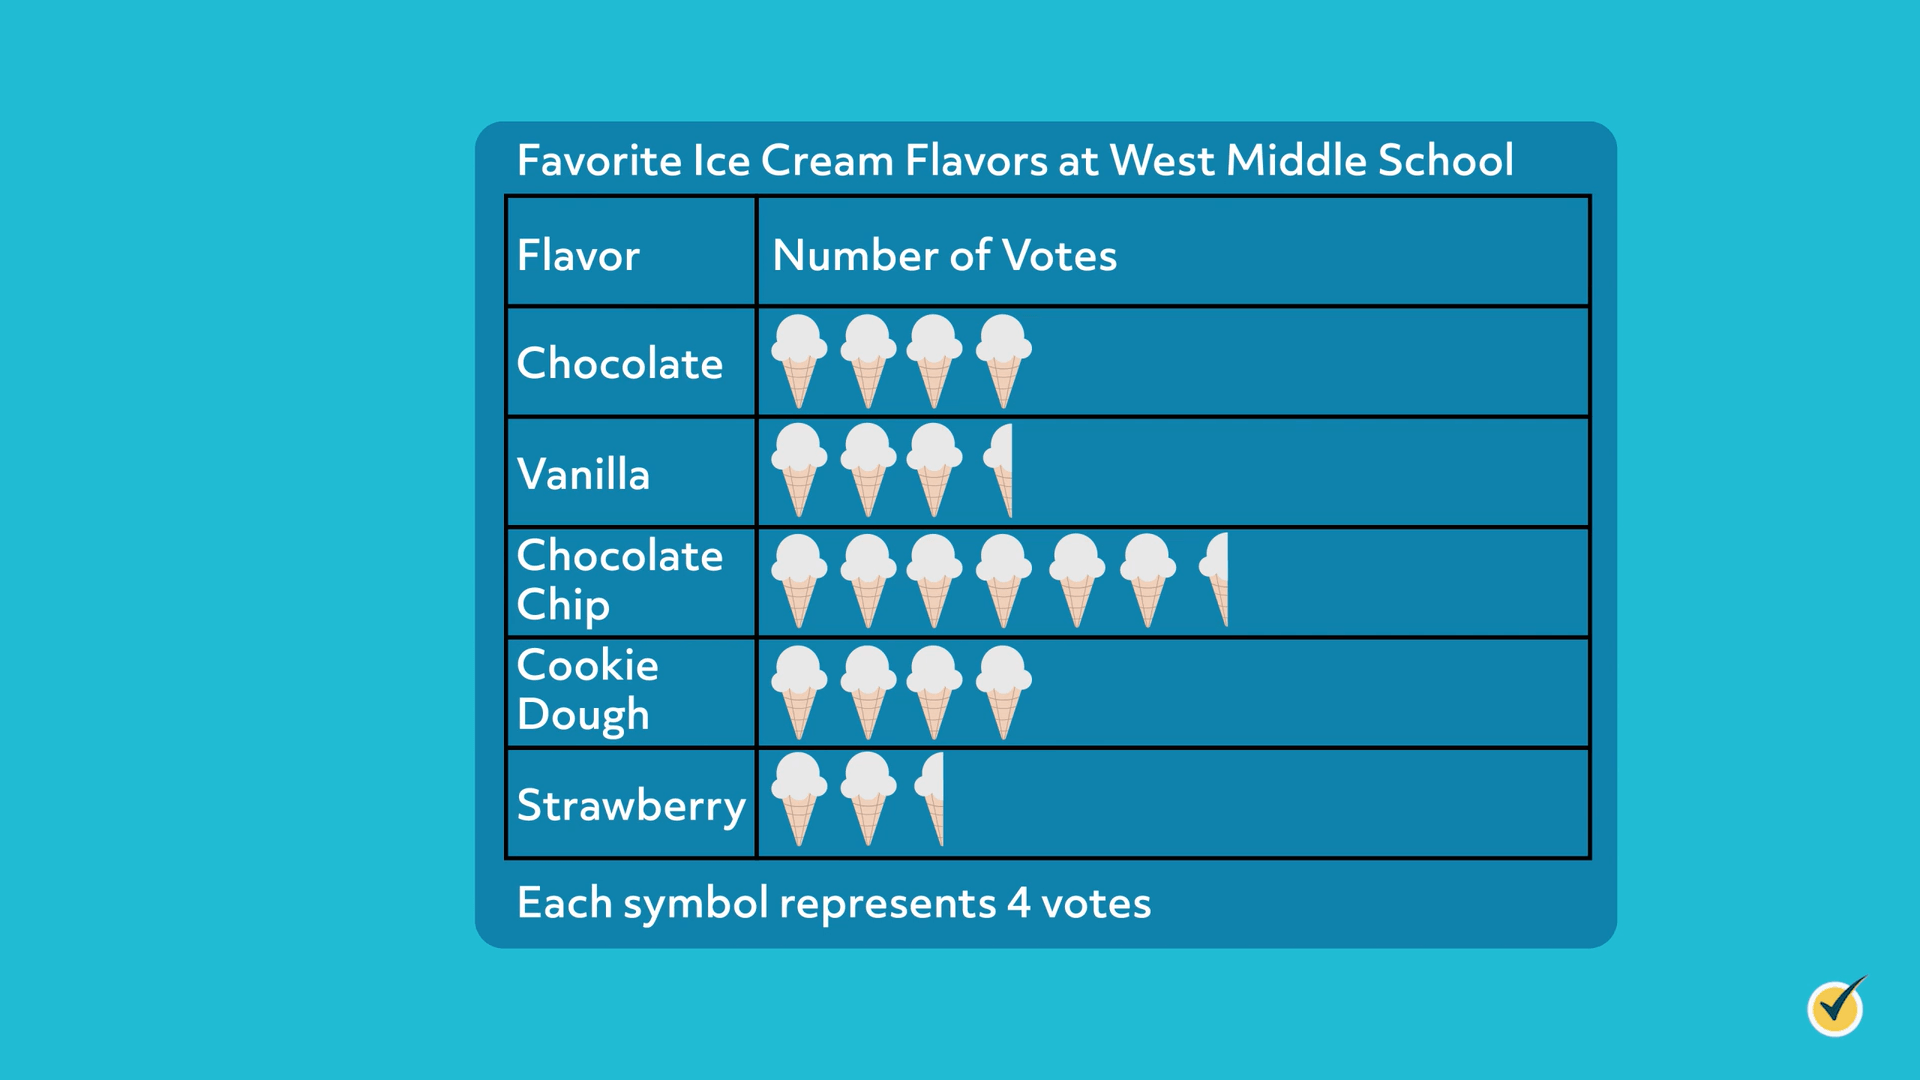
Each symbol represents 4 votes
This pictograph is about the favorite ice cream flavors of students at West Middle School. According to the key, each ice cream cone represents 4 votes. In this pictograph, some categories have half symbols. If a whole symbol represents 4 votes, then each half symbol equals half of 4, which is 2.
Now that we understand how to read a pictograph with half symbols, let’s see if we can answer a few questions together.
- How many more students voted for chocolate than strawberry?
Start by finding the total number of votes for each flavor. Remember that each symbol represents 4 votes. Since there are 4 symbols next to chocolate, multiply \(4\times{4}\), which equals 16. Therefore, 16 students voted for chocolate.
There are 2 whole symbols and 1 half symbol next to strawberry. Remember that each whole symbol equals 4 votes, and each half symbol equals 2. Multiply the number of whole symbols by 4 and add 2 to the product for the half symbol. \(2\times{4}=8\) and \(8+2=10\). Therefore, 10 students voted for strawberry.
To figure out how many more students voted for chocolate than strawberry, subtract the strawberry votes from the chocolate votes. \(16-10=6\), so 6 more students voted for chocolate than strawberry.
- How many students voted for either vanilla or chocolate chip?
Start by finding the total number of votes for each flavor. Recall that each symbol equals 4 votes, and each half symbol equals 2 votes. Let’s start with vanilla, which has 3 whole symbols and 1 half symbol. To find the total votes for vanilla, multiply each whole symbol by 4 and add 2 to the product for the half symbol. \(3×4=12\) and \(12+2=14\). Therefore, there are 14 votes for vanilla.
Next, find the total number of votes for chocolate chip, which has 6 whole symbols and 1 half symbol. To find the total number of votes, multiply each whole symbol by 4 and then add 2 to the product. \(6×4=24\) and \(24+2=26\). Therefore, the total number of votes for chocolate chip is 26.
The last step is to add the total number of votes for each flavor. \(14+26=40\), so 40 students voted for either vanilla or chocolate chip.
- How many students voted altogether, assuming each student voted one time?
First, find the total number of votes for each flavor. Remember that each symbol represents 4 votes, and each half symbol represents 2 votes. Multiply 4 times the number of symbols for each flavor. Then, add 2 to the product for any half symbols.
| Chocolate | \(4\times{4}=16\) |
| Vanilla | \((4\times{3})+2=14\) |
| Chocolate Chip | \((4\times{6})+2=26\) |
| Cookie Dough | \(4\times{4}=16\) |
| Strawberry | \((4\times{2})+2=10\) |
Next, add the total votes for each flavor to find the total number of students that voted. \(16 + 14 + 26 + 16 + 10 = 82\), so 82 students voted altogether.
Example #5
I have one more pictograph for you to analyze on your own.
Ms. Cole and Mr. Jacob surveyed their classes to find their favorite after-school club. The results are shown in the 2 pictographs below. Use the information given to answer the following questions:
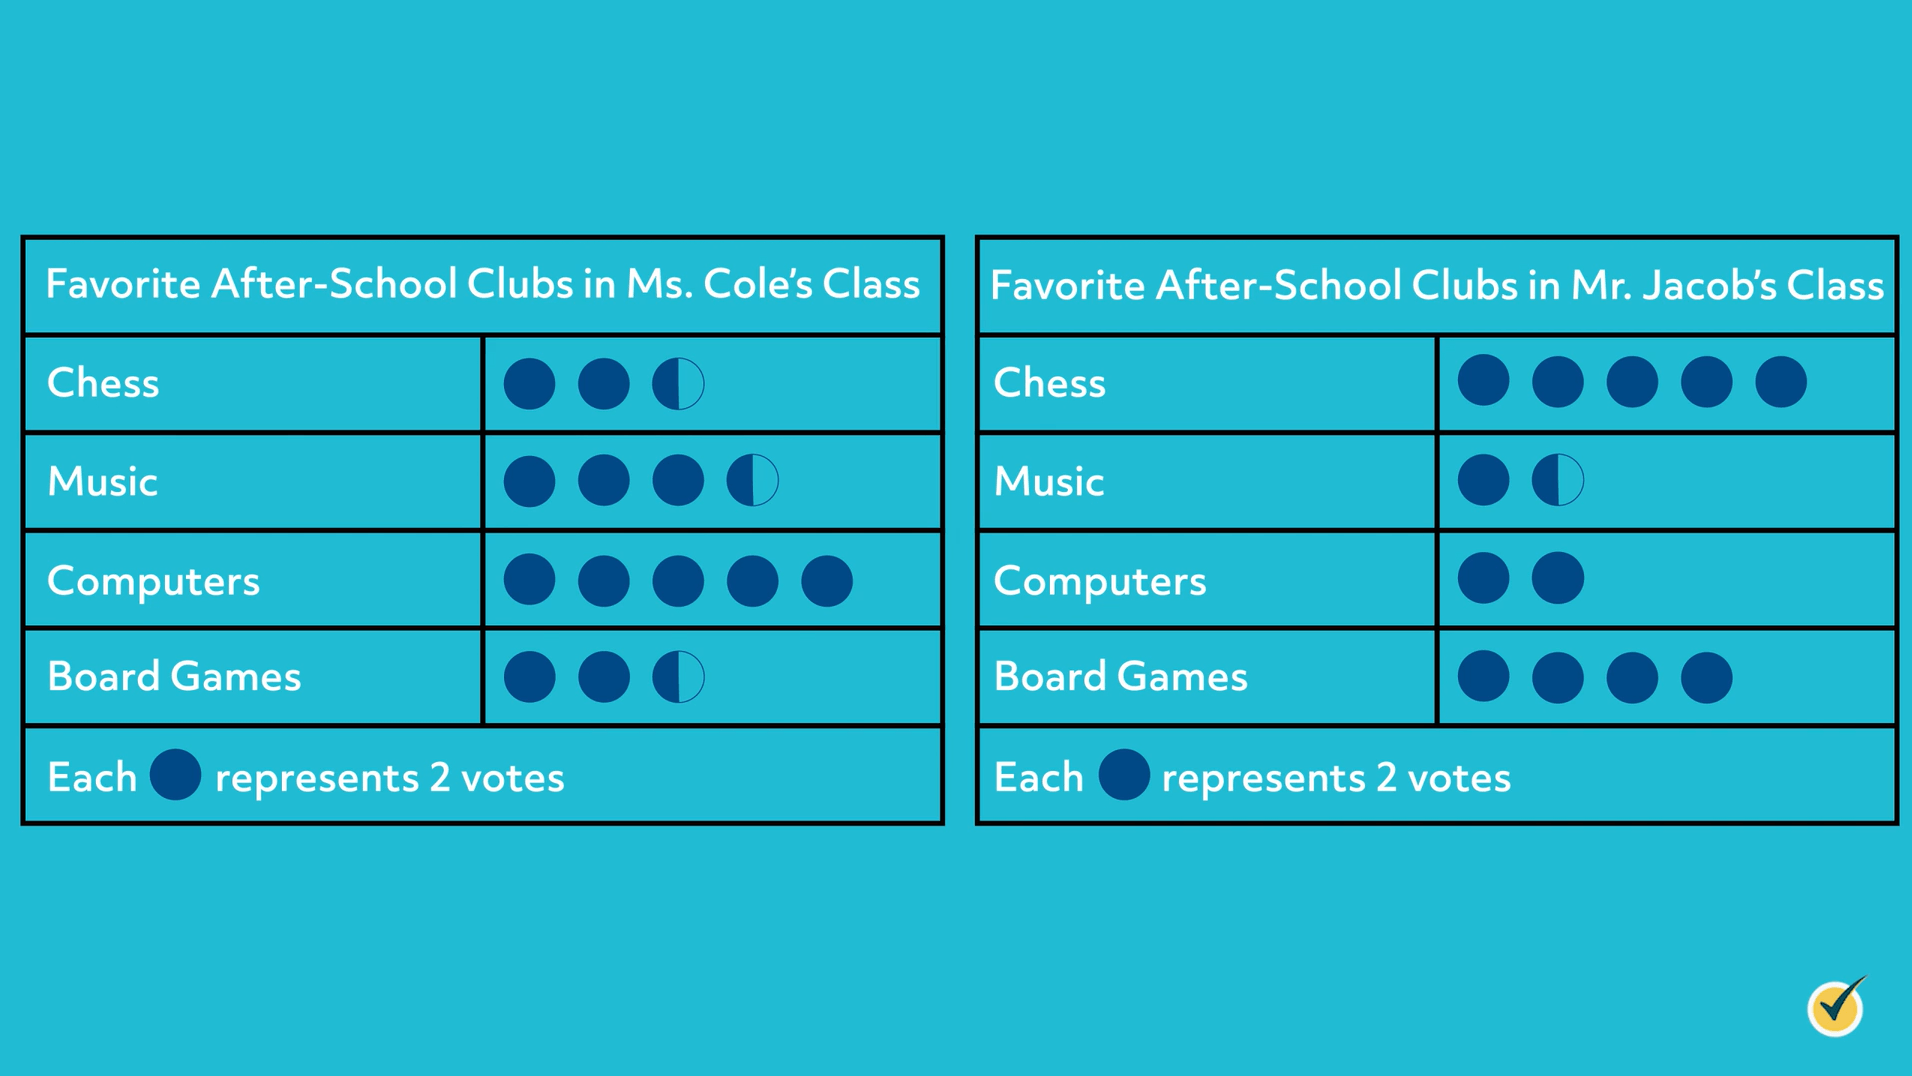
- How many more students voted for the music club in Ms. Cole’s class than Mr. Jacob’s class?
- How many students voted for the chess club in both classes? combined
- Which clubs received the same number of votes in Ms. Cole’s class and Mr. Jacob’s class?
Pause the video, analyze the pictograph, and see if you can answer these questions yourself. When you’re ready, resume the video, and we’ll go over the answers together.
Now that you’ve tried these problems, let’s go over them together.
- How many more students voted for the music club in Ms. Cole’s class than Mr. Jacob’s class?
Start by finding the total number of votes for the music club in each class. According to the key, each symbol represents 2 votes. Each half symbol represents half of 2, which is 1. There are 3 whole symbols and 1 half symbol next to music in Ms. Cole’s class. Multiply each whole symbol by 2 and add 1 for the half symbol. \(3\times{2}=6\), and \(6+1=7\), so there are 7 votes for music club in Ms. Cole’s class.
Looking at Mr. Jacob’s class, we see 1 whole symbol and 1 half symbol. Multiply each whole symbol by 2 and add 1 for the half symbol. \(1×2=2\), and \(2+1=3\), so there are 3 votes for the music club in Mr. Jacob’s class.
To figure out how many more students voted for music club in Ms. Cole’s class, subtract the votes in Mr. Jacob’s class from the votes in Ms. Cole’s class. \(7-3=4\), so 4 more students voted for the music club in Ms. Cole’s class.
- How many students voted for the chess club in both classes combined?
First, find the total number of votes for the chess club in each class. Recall that each symbol equals 2 votes, and each half symbol equals 1 vote. Starting with Ms. Cole’s class, there are 2 whole symbols and 1 half symbol next to chess. To find the total votes, multiply each whole symbol by 2 and add 1 for the half symbol. \(2×2=4\), and \(4+1=5\), so there are 5 votes for chess club in Ms. Cole’s class.
In Mr. Jacob’s class, there are 5 whole symbols next to chess. To find the total votes, multiply each whole symbol by 2. \(2×5=10\), so there are 10 votes for chess club in Mr. Jacob’s class.
Add these votes to find the total number of votes for the chess club. Since \(5+10=15\), 15 students voted for the chess club in both classes combined.
- Which clubs received the same number of votes in Ms. Cole’s class and Mr. Jacob’s class?
There are 5 symbols next to computers in Ms. Cole’s class and 5 symbols next to chess club in Mr. Jacob’s class. Since each symbol represents 2 votes and \(2×5=10\), each club received 10 votes.
Great job!
I hope this video about pictographs was helpful. Thanks for watching, and happy studying!
Pictograph Practice Questions
The pictograph shows the number of pies sold each day. How many pies were sold Monday through Friday?

If you count the pies in the rows Monday through Friday, you’ll see there are 19 pie symbols. Each symbol represents 20 pies, so multiply \(19\times20\).
\(19\times20=380\)
This means 400 pies were sold Monday through Friday.
A class of students took a survey to determine which cake flavor is most popular. If each student voted one time, how many students are in the class?

Each full cake represents 4 votes and each half cake represents 2 votes. The pictograph shows 8 full cakes and 2 half cakes. This is the same thing as 9 full cakes. Since each cake represents 4 votes, multiply \(9\times4\).
\(9\times4=36\)
Therefore, there are 36 students in the class.
There are a variety of trees as represented in the pictograph below. If there are 18 palm trees, how many trees does each symbol represent?

We know there are 18 palm trees and that there are 6 palm tree symbols on the pictograph. Divide to find the number of trees each symbol represents.
\(18\div6=3\)
Therefore, each symbol represents three trees.
You volunteer at a soccer club that hosts games each week. The pictograph below represents the number of players at the club each week. 28 club members showed up for the games during week 5. How many players showed up for games during week 1?

28 players showed up for games during week 5. The pictograph shows 3 full soccer balls and 1 half soccer ball for week 5. Divide to find the number of players each soccer ball represents.
\(28\div3.5=8\)
This means that each soccer ball represents 8 players. Week 1 has 2 full soccer balls and then \(\frac{3}{4}\) of a soccer ball.
\(\frac{3}{4}\times8=6\)
The \(\frac{3}{4}\) of a soccer ball represents 6 players. Since each full soccer ball represents 8 players, then week 1 has \(8+8+6=22\) players.
A new author is selling copies of their first book. The pictograph shows the number of books sold each day. What day did the author sell the most books? How many books were sold that day?

Wednesday has the most book symbols in the pictograph. There are 8 book symbols on Wednesday, and each symbol represents five copies sold.
\(8\times5=40\)
This means that 40 books were sold on Wednesday.