

Hello, and welcome to this video about box and whisker plots!
Today, we’ll learn how to interpret box and whisker plots to answer questions about data. We’ll also discuss when to display data with a box and whisker plot.
Reviewing Terms
Before we get started, let’s review a few things. First, a data set is a collection of numbers that relate to a specific topic. For instance, class scores on a math test are a data set.
Mathematicians use graphs to illustrate data sets. A box and whisker plot, also called a box plot, is a type of graph that displays quantitative data.
Graphing a Box and Whisker Plot
The graph of a box and whisker plot involves plotting five data values. These values are also called the five-number summary of a set of data when ordered from least to greatest. The data values are:
- The minimum, or lowest number in the data set
- The lower quartile (called \(\text{Q}_1\)), which is the median of the first half of the data set
- The median, which is the data set’s middle value
- The upper quartile (called \(\text{Q}_3\)), which is the median of the second half of the data set
- The maximum, or highest number in the data set
When graphed, a box and whisker plot looks like a rectangular box with a vertical line going through it. The box is drawn from \(\text{Q}_1\) to \(\text{Q}_3\), and the vertical line intersecting it represents the median of the data set. The box has two horizontal lines called whiskers on either side of it, extending to the maximum and minimum values in the data set:
Example
Let’s look at an example of a box and whisker plot together.
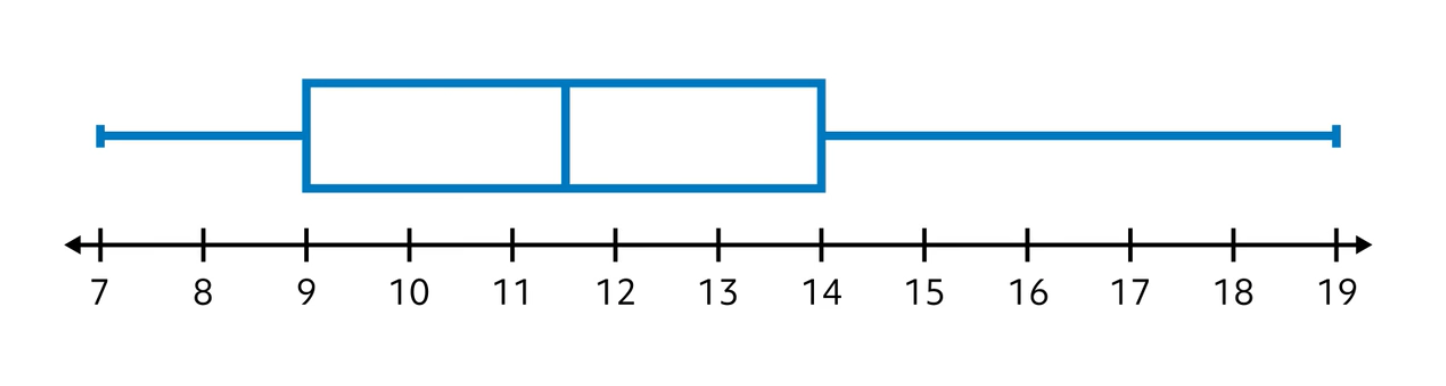
Using the number line below the box and whisker plot, let’s identify the five-number summary of this data set.
The minimum is the lowest number in the data set. This data point is the furthest to the left. It’s connected to the box by a whisker. In this case, the minimum is 7.
The maximum is the highest number in the data set. This data point is the furthest to the right. It’s also connected to the box by a whisker. In this case, the maximum is 19.
Next, let’s identify the median. The median is shown as a vertical line inside the box. In this case, the line intersects the box between 11 and 12. Therefore, the median is 11.5.
From here, we can identify the lower and upper quartiles. The lower quartile (\(\text{Q}_1\)) is shown as a vertical line forming the left side of the box. In this case, the lower quartile is 9. The upper quartile (\(\text{Q}_3\)) is shown as a vertical line forming the right side of the box. In this case, the upper quartile is equal to 14.
To summarize:
- Minimum = 7
- Lower quartile (\(\text{Q}_1\)) = 9
- Median = 11.5
- Upper quartile (\(\text{Q}_3\)) = 14
- Maximum = 19
Creating a Box and Whisker Plot
Now that we know how to interpret a box and whisker plot, let’s look at a data set and use those numbers to create our own.
Consider the following data set:
Before we can create a box and whisker plot, we have to put our numbers in order from least to greatest:
Now that the numbers are in order, we can identify the five-number summary. Let’s start with the minimum and maximum. The minimum is 5 because that is the lowest number in our data set.
Likewise, the maximum is 20 because that is the highest number in our data set.
Next, identify the median. Recall that the median is the middle value in a list of numbers ordered from least to greatest. In this data set, the median is 18.
From here, identify the lower quartile and upper quartile. To identify the lower quartile, examine the data values to the left of the median, 5, 6, and 8:
The lower quartile is the middle value of this portion of the data set. In this case, the middle value of 5, 6, and 8, is 6. Therefore, the lower quartile is 6.
To identify the upper quartile, examine the data values to the right of the median, 18, 20, and 20.
The upper quartile is the middle value of this portion of the data set. In this case, the middle value of 18, 20, and 20, is 20. Therefore, the upper quartile is 20.
To summarize:
- Minimum = 5
- Lower quartile (\(\text{Q}_1\)) = 6
- Median = 18
- Upper quartile (\(Q\text{3}\)) = 20
- Maximum = 20
Now that we have the five-number summary, we can create a box and whisker plot.
- On a number line, draw small vertical lines above each of these numbers: 5, 6, 18, and 20.
- Next, construct the box portion of the box and whisker plot. Draw a rectangle from the \(\text{Q}_1\) value at 6 to the \(\text{Q}_3\) value at 20.
- From here, draw the vertical line at 18 to represent the median.
- Last, draw the whiskers extending to the minimum and maximum values.
- Draw one horizontal line extending from the left of the box to the minimum, which is 5. Note that the maximum is 20, which is the same as the upper quartile. Since this value is already part of the graph, we do not need to draw a whisker extending to the right.
The interquartile range (IQR) is the width of the box in a box and whisker plot. In other words, it’s the difference between the upper and lower quartiles. In the example we just looked at, the upper quartile was 20, and the lower quartile was 6. Since \(20-6=14\), the IQR for this set of data is 14.
Outliers
Sometimes, data sets include outliers. An \(outlier\) is a data point that lies outside most of the other values in a data set. If a number is significantly greater than or less than the rest of the numbers in a data set, it’s probably an outlier.
The 1.5 IQR rule determines whether a number is an outlier. If a data point is less than \(\text{Q}_1-1.5\times{IQR}\), then it is an outlier to the left of the box and whisker plot. Likewise, if a data point is greater than \(\text{Q}_3+1.5\times{IQR}\), then it is an outlier to the right.
Let’s look at an example of a set of data with an outlier. Consider the following data set:
Let’s find the five-number summary, look for outliers, and create a box and whisker plot. First, order the numbers in the data set from least to greatest:
Now that the numbers are in order, we can identify the five-number summary. Let’s start with the minimum and maximum. The minimum is 70 because that is the lowest number in our data set.
Likewise, the maximum is 100 because it is the highest number in our data set.
Next, identify the median. Recall that the median is the middle value in a list of numbers ordered from least to greatest. Since this list has an even number of data, there are two data points in the center: 79 and 82.
To identify the median, add these numbers together and divide them by 2. \(79+82=161\), and \(161\div{2}=80.5\). Therefore, the median is 80.5.
From here, identify the lower quartile and upper quartile. Let’s start with the lower quartile. To identify this number, examine the data values to the left of the median, which is 80.5. These numbers are 70, 72, 74, 78, and 79:
The lower quartile is the middle value of this portion of the data set. In this case, the middle value is 74, so the lower quartile is 74.
To identify the upper quartile, examine the data values to the right of the median. These numbers are 82, 84, 84, 86, and 100:
The upper quartile is the middle value of this portion of the data set. In this case, the middle value is 84, so the upper quartile is 84.
To summarize:
- Minimum = 70
- Lower quartile (\(\text{Q}_1\)) = 74
- Median = 80.5
- Upper quartile (\(\text{Q}_3\)) = 84
- Maximum = 100
Next, we want to find the interquartile range (IQR). We can use the IQR to look for outliers in the data set. The IQR is the upper quartile minus the lower quartile. \(\text{Q}_3-\text{Q}_1=84-74=10\). Therefore the IQR is equal to 10.
From here, apply the 1.5 IQR rule to see if there are any outliers:
| \(\text{Q}_1-1.5\times{IQR}\) | \(\text{Q}_3+1.5\times{IQR}\) |
| \((74)-1.5\times{(10)}\) | \((84)+1.5\times{(10)}\) |
| \(74-15\) | \(84+15\) |
| \(59\) | \(99\) |
According to the 1.5 IQR rule, any data values that are less than 59 or greater than 99 are considered outliers. Therefore, 100 is an outlier in our data set.
On a box and whisker plot, outliers are usually shown as separate points. Separating 100 from the data set, the maximum is the next highest number that is not an outlier. In this data set, that number is 86.
On a number line, draw small vertical lines above each number in the five-number summary: 70, 74, 80.5, 84, and 86. Additionally, draw a point as an open circle at the outlier, 100.
Next, construct the box portion of the box and whisker plot. Draw a rectangle from the \(\text{Q}_1\) value at 74 to the \(\text{Q}_3\) value at 84. From here, draw the vertical line at 80.5 to represent the median.
Last, draw the whiskers extending to the minimum and maximum values. Draw one horizontal line extending from the left of the box to the minimum, which is 70. Draw another horizontal line extending from the right of the box to the maximum, which is 86.
Example Scenario
Box and whisker plots are useful ways to display quantitative data because they’re easy to read. Additionally, they split the data into chunks of 25%.
A box and whisker plot shows the shape of the distribution, its variability, and its central value. For these reasons, researchers and mathematicians use them to visually summarize quantitative data.
Let’s consider a scenario and interpret a box and whisker plot to answer some questions about the data.
The five-number summary of the data is:
- Minimum = 15
- Lower quartile (\(\text{Q}_1\)) = 33
- Median = 41.5
- Upper quartile (\(\text{Q}_3\)) = 48
- Maximum = 56
The graph also shows one outlier, which is 8.
Given this information, answer the following questions:
- What is the greatest amount run by one team member during the week?
The greatest amount of miles run is the maximum. Since the maximum in this data set is 56, the greatest amount run by one team member during the week is 56 miles.
- What percentage of team members ran between 33 and 48 miles during the week?
50% of team members ran between 33 and 48 miles during the week. Each quartile includes approximately 25% of the data in the data set. Therefore, the lower and upper quartile together contain approximately 50% of the data in the data set.
- Are there any injured team members? If so, how many miles did he or she run during the week? (Injured team members run significantly fewer miles than the majority of the team.)
There is one injured team member, represented by the outlier. This team member ran 8 miles during the week.
I hope this video about box and whisker plots was helpful. Thanks for watching, and happy studying!
Box and Whisker Plot Practice Questions
Identify the five-number summary for the box and whisker plot formed by the set of data shown below.

\(Q_1\) = 85
Median = 80
\(Q_3\) = 70
Maximum = 90
\(Q_1\) = 70
Median = 80
\(Q_3\) = 85
Maximum = 90
\(Q_1\) = 85
Median = 80
\(Q_3\) = 70
Maximum = 60
\(Q_1\) = 80
Median = 70
\(Q_3\) = 85
Maximum = 60
The minimum value for the data is the value farthest left on the plot. It is connected to the box by a whisker to the left of the box. In this case, the minimum is 60.
The first quartile (\(Q_1\)) is at the vertical line forming the left side of the box. The value for \(Q_1\) is 70.
The median is at the vertical line inside of the box. The vertical line inside of the box is at 80, so 80 is the median.
The third quartile (\(Q_3\)) is at the vertical line forming the right side of the box. The value for \(Q_3\) is 85.
The maximum value for the data is the value farthest right on the plot. It is connected to the box by a whisker to the right of the box. In this case, the maximum is 90.
Which of the following is a sketch of the box and whisker plot for the data set listed below?


Step 1
Before constructing our box and whisker plot for our data set, we must order the data from least to greatest:
\(\{4,8,9,12,14,15,28\}\)
Step 2
Identify the five-number summary to sketch our box and whisker plot.
- The minimum value of the data set is 4.
- The median in the data set is the middle value.
After ordering our numbers from least to greatest, we can see the middle number is 12.
\(\{4,8,9,\mathbf{12},14,15,28\}\)
The first quartile (\(Q_1\)) is the median of the numbers to the left of the median of the data set.
\(\{\underline{4,\mathbf8,9},12,14,15,28\}\)
The median of the three numbers to the left of 12 is 8, so \(Q_1=8\).
The third quartile (\(Q_3\))is the median of the numbers to the right of the median of the data set.
\(\{4,8,9,12,\underline{14,\mathbf{15},28}\}\)
The median of the three numbers to the right of 12 is 15, so \(Q_3=15\).
The maximum value of the data set is 28.
Step 3
Sketch a box and whisker plot using our five-number summary.
Draw small vertical lines above each of the five numbers in the five number summary found in step 2.

Next, construct the box portion of the box and whisker plot. Draw a rectangle from the \(Q_1\) value to the \(Q_3\) value.

Now, draw the whiskers. Draw a horizontal line segment representing the left whisker. The line connects the left side of the box to the vertical line at the minimum value.
Finally, draw a horizontal line segment representing the right whisker. The line connects from the right side of the box to the vertical line at the maximum value. You can shade the box in, but it is not necessary to do so.
What is the interquartile range for the data set given below?
Step 1
Before we can find the inner quartile range for our data set, we must order it from least to greatest:
\(\{47,50,55,62,68,70,78,80,82,90\}\)
Step 2
The inner quartile range (IQR) is the difference in \(Q_3\) and \(Q_1\). To find \(Q_3\) and \(Q_1\), we need to find the median.
There are an even number of values in our data set, so the median is the average between the two middle values of 68 and 70.
\(\text{Median}=\dfrac{68+70}{2}=69\)
Step 3
\(Q_1\) is the median of the numbers to the left of the median of the data set.
\(\{\underline{47,50,\mathbf{55},62,68},70,78,80,82,90\}\)
The median of the five numbers to the left of 69 is 55, so \(Q_1=55\).
\(Q_3\) is the median of the numbers to the right of the median of the data set.
\(\{47,50,55,62,68,\underline{70,78,\mathbf{80},82,90}\}\)
The median of the five numbers to the right of 69 is 80, so \(Q_3=80\).
\(\text{Inner quartile range}=Q_3-Q_1\)\(\: =80-55=25\)
A basketball player records the number of points she scores in each game of an eleven-game season. The number of points scored in each game are given below.
Which of the following is a sketch of the box and whisker plot that represents the number of points the basketball player scored in each game of the season?


Step 1
Before constructing our box and whisker plot for our data set, we must order it from least to greatest:
\(\{5,7,10,11,12,15,15,16,17,19,21\}\)
Step 2
Identify the five-number summary to sketch our box and whisker plot.
- The minimum value for the data set is 5.
- The median in the data set is the middle value.
After ordering our numbers from least to greatest, we can see the middle number is 15.
\(\{5,7,10,11,12,\mathbf{15},15,16,17,19,21\}\)
The first quartile (\(Q_1\)) is the median of the numbers to the left of the median of the data set.
\(\{\underline{5,7,\mathbf{10},11,12},15,15,16,17,19,21\}\)
The median of the five numbers to the left of the first number 15 in the set is 10, so \(Q_1=10\).
The third quartile (\(Q_3\)) is the median of the numbers to the right of the median of the data set.
\(\{5,7,10,11,12,15,\underline{15,16,\mathbf{17},19,21}\}\)
The median of the five numbers to the right of the first number 15 in the set is 17, so \(Q_3=17\).
Step 2
Sketch a box and whisker plot using our five-number summary.
Draw small vertical lines above each of the five numbers in the five number summary.

Next, construct the box portion of the box and whisker plot. Draw a rectangle from the \(Q_1\) value to the \(Q_3\) value.

Now, draw the whiskers. Draw a horizontal line segment representing the left whisker. The line connects the left side of the box to the vertical line at the minimum value.
Finally, draw a horizontal line segment representing the right whisker. The line connects the right side of the box to the vertical line at the maximum value. You can shade the box in, but it is not necessary to do so.
You have a part-time job during the summer to save money for the upcoming fall semester of school. You work 14 weeks during the summer and are able to save money each of the 14 weeks you work. The money you save, in dollars, each week is given in the data set below.
What are the outliers for the money you save each week, if any?
To determine if there are any outliers, apply the 1.5 IQR (inner quartile range) rule.
The 1.5 IQR rule states if any of the numbers in the data set are less than \(Q_1-1.5\times\text{IQR}\), where \(Q_1\) is the first quartile of the data set, then they are outliers. Similarly, if any of the numbers in the data set are greater than \(Q_3+1.5\times\text{IQR}\), where \(Q_3\) is the third quartile of the data set, then they are outliers of the data set.
Step 1
Before the 1.5 IQR rule can be applied, we must order the data set from least to greatest.
\(\{45,55,64,65,75,75,80,82,85,\)\(\:93,95,98,100,142\}\)
Step 2
The IQR is the difference in \(Q_3\) and \(Q_1\). To find \(Q_3\) and \(Q_1\), we need to find the median of the data set.
Since there are an even number of values in our data set, the median is the average between the two middle values of 80 and 82.
\(\text{Median}=\dfrac{80+82}{2}=81\)
Step 3
\(Q_1\) is the median of the numbers to the left of the median of the data set.
\(\{\underline{45,55,64,\mathbf{65},75,75,80},82,\)\(\:85,93,95,98,100,142\}\)
The median of the seven numbers to the left of 81 is 65, so \(Q_1=65\).
\(Q_3\) is the median of the numbers to the right of the median of the data set.
\(\{45,55,64,65,75,75,80,\)\(\:\underline{82,85,93,\mathbf{95},98,100,142}\}\)
The median of the seven numbers to the right of 81 is 95, so \(Q_3=95\).
\(\text{Inner quartile range}\)\(\:=Q_3-Q_1=95-65=30\)
Step 4
Apply the 1.5 IQR rule.
\(Q_1-1.5\times IQR=65-1.5\times30\)\(\:=65-45=20\)
\(Q_3+1.5\times IQR=95+1.5\times30\)\(\:=95+45=140\)
According the 1.5 IQR rule, any numbers in the data set less than 20 or greater than 140 are considered outliers. There are no numbers less than 20 in the set. The only number greater than 140 in the set is 142.
Therefore, the $142 that you saved for one of the weeks you worked over the summer is the only outlier.