

Hi, and welcome to this video about skew. In this video, we will discuss the differences in data distributions with respect to symmetry.
Data Distributions
The distributions of quantitative data using a histogram tell us about the frequency of numeric outcomes in a sample of data. The graph lists the possible outcomes in increasing order along the \(x\)-axis, and the counts of each occurrence on the \(y\)-axis. The pattern that is revealed can take on many shapes that are all helpful in statistical analysis. When a sample size is large enough, we can use theoretical models to make generalizations about the data collected. Analysis of data distributions focuses on the concepts of center, shape, and spread.
Mean, Median, and Mode
The statistics having to do with the center of the data set are median, mean, and mode.
- The median is the value that is in the exact center of the data-set. Fifty-percent of the values are higher than the median and fifty-percent are lower.
- The mean is the average value of the data, calculated by adding all values together and dividing by the number of values in the sample.
- The mode is the value that occurs most often. The variance and standard deviation are statistics that describe the spread of the data. These are quantifiable values to represent how far individual data points are from the mean.
Normal Distributions vs. Skewed Distributions
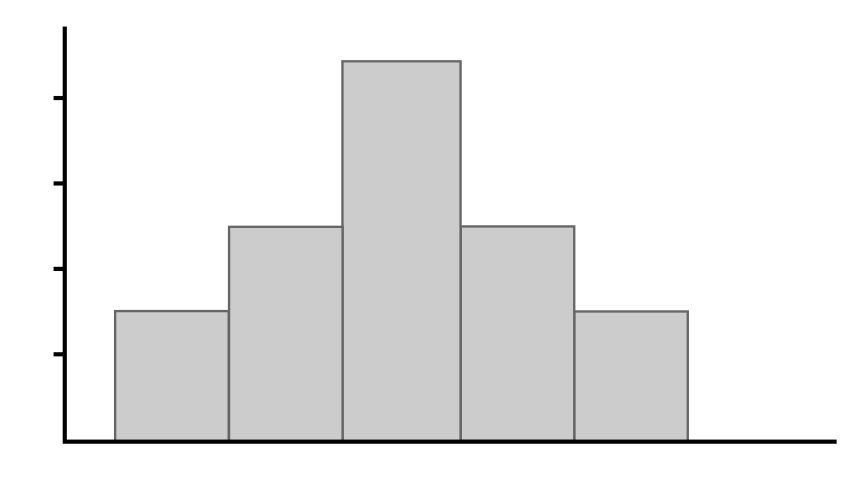
The shape of the data can be bell-shaped, as seen in a “normally” distributed model. The symmetry of the model indicates that the median and the mean values are comparable. The data tapers off in a consistent pattern away from the center to “tails” on either side.
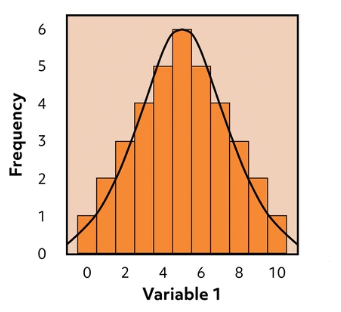
When distributions are not symmetrical, they may be described as skewed.
Right-Skewed vs. Left-Skewed Distributions
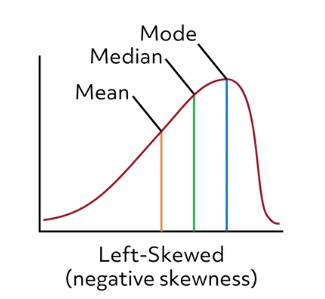
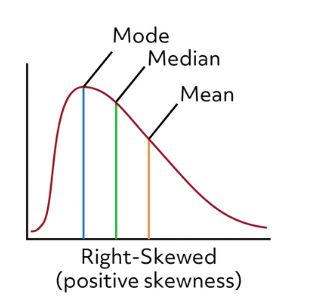
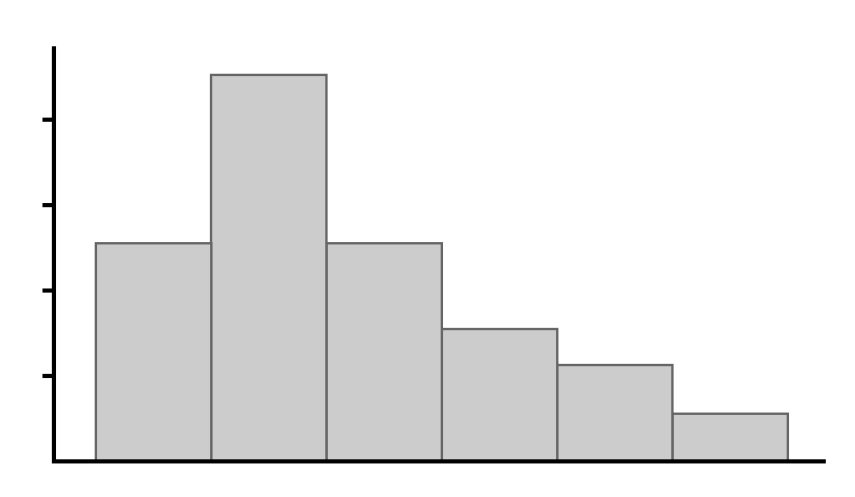
A distribution that is “skewed right” would have a longer tail on the right side of the center. This occurs when lower values are more frequent in the data set, but the few larger values are “pulling” the tail to the right. As a result, calculation for the mean value will be affected.
The mean value will be higher than the median in a right-skewed distribution. Similarly, if a data set had a longer tail on the left side, that would indicate that there would be a greater frequency of high-valued data points than low-valued data points. The mean would then be lower than the median in a left-skewed distribution.
Skew Formula
Here is the formula used to quantify skew:
In this formula, \(n\) represents the size of the sample, \(x_{i}\) represents each individual data value, and \(\bar{x}\) represents the sample mean.
Note that this formula reflects the spread of the data, by comparing the magnitude of each data value to the mean. Cubing the differences of the data points from the mean in the numerator maintains the sign. For example, a difference that is negative when cubed will remain negative, which is essential for capturing the “direction” of the skew.
Interpreting Skew Values
The size of the sample should be kept in mind when interpreting a skew value. As with all statistics, a larger sample size generates more reliable results. In general, skew values close to 0 result from distributions that are nearly normal. The larger the skew value is in the negative direction, the more extreme the left skew is in the data. Larger positive skew value indicate a stronger right skew.
Thank you for watching this review on skew. See you next time!
Skew Practice Questions
Which data distribution concept does skew describe?
Skew is how we describe data distributions that are not symmetrical. In data distribution, symmetry and asymmetry refer to shape.
Which of the following graphs shows a data distribution that is skewed left?
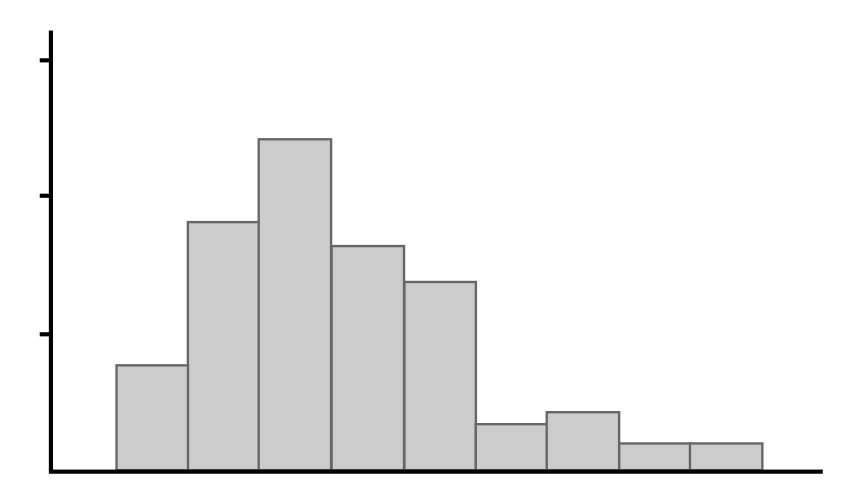
A distribution that is skewed left has a tail on the left side. Higher values are more frequent in the data set, but a few smaller values pull the tail to the left. This is best illustrated by the distribution in Graph A.
Which statement is true?
A data distribution that skews right has a tail on the right side. That means it has a few large values “pulling” the data distribution to the right. As a result, the mean value is higher than the median in a distribution that skews right.
In a data distribution that skews left, the opposite is true. In this type of distribution, the mean value is lower than the median.
Will and Christina surveyed their classmates to find out how many pets each person had. They recorded and ordered their data, which is shown below. When the data is graphed, Will thinks it will skew right. Christina thinks the data will skew left. Who is correct, and why?
There are more data points with low values (0s, 1s, and 2s), but a few larger values (3s, 4, and 5) pull the data set to the right.
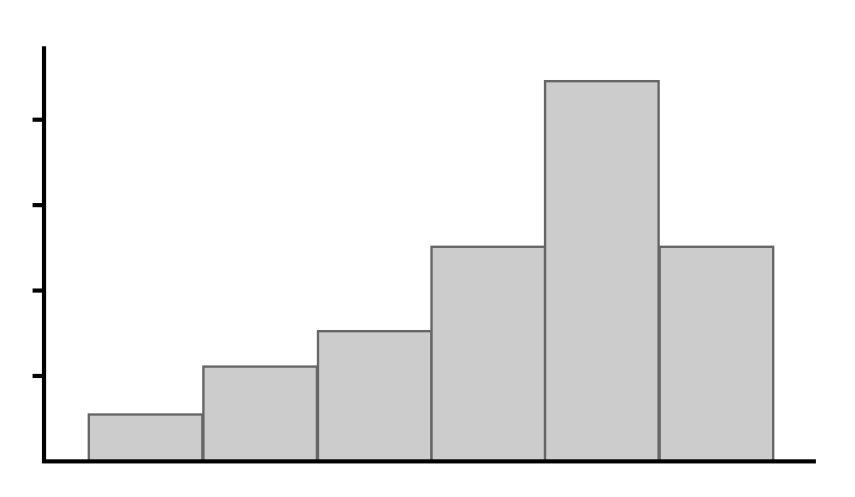
Michelle and Justin surveyed their after-school club to find out how many hours of television each student watched over the weekend. They recorded their data in the histogram shown below. Based on this distribution, which of the following statements is true?

A distribution that skews left has a longer tail on the left side, as shown in this histogram. When quantified, the sign of the value for skew indicates its direction.
A graph that skews left is represented by a negative value and a graph that skews right is represented by a positive value.