
Hi, and welcome to this video about piecewise functions! In this video, we will explore:
- What piecewise functions are
- How piecewise functions are defined
- And how piecewise functions can be used
Function – Definition
First, let’s look at the definition of a function. A function is a relationship where a single output is assigned to each input.
Many functions belong to function families because their equations and graphs all have similar characteristics.
For example, functions in the linear family have equations that resemble \(f(x)= mx+b\) and their graphs are straight lines. Functions in the quadratic family have equations that look like \(f(x) = ax^2\), and their graphs are parabolas.
Piecewise functions are not considered a function family on their own. As the name suggests, they are functions comprised of pieces of other functions.
Absolute Value Functions
The first piece we’re going to look at is the absolute value function.
Functions in the absolute value family have equations that resemble \(f(x) = |x|\) and their graphs all have a characteristic “V” shape. This is the graph and a section of the table of values of \(f(x) =|x|\).
Instead of a single V, \(f(x)\) can also be visualized as pieces of two linear functions. On the left, \(f(x) =-x\), and on the right, \(f(x)=x\).
As we “read” the graph from left to right, we are on the function \(f(x) =-x\) until \(x=0\). At that point, the function definition changes to \(f(x)=x\).
The domain of the absolute value function is all real numbers. Normally, both \(f(x) =-x\) and \(f(x) =x\) also have domains of all real numbers, but if we were to graph them together, the graph would look like this and we would no longer have a function.
So each piece needs to be defined on a section of its domain in order to define a piecewise function. If the left function is only defined for negative \(x\)-values and the right is only defined for positive \(x\)-values (and we put the 0 into one of them—more on that in a minute), we can define this as a single piecewise function.
One way to visualize this is to graph both linear functions and erase the sections that are not part of the absolute value function.
Other Piecewise Functions
Let’s take a quick break and practice describing a couple of piecewise functions in terms of what their pieces look like and where those pieces are defined.
Integer Function
First up is the greatest integer function, \(f(x)=\lfloor x \rfloor\). This is also called the floor function or stair step function.
This function is made up of pieces of constant functions that are 1 unit wide.
Sawtooth Function
Next, we have the sawtooth function, \(f(x) = x – \lfloor x \rfloor\). This function is also called the castle rim function.
This function is made up of pieces of parallel linear functions that are one unit long
Naming Piecewise Functions
There are two criteria for naming piecewise functions:
- Reading the pieces from top-to-bottom in the list corresponds to reading the graph from left-to-right. So the first piece in the list is the left piece on the graph.
- The domains of the pieces must “add up to” the domain of the entire function.
Let’s start by rewriting our absolute value function in this form.
Here’s the list of expressions that define each piece from left to right:
\[
f(x) =
\begin{cases}
-x \\
x
\end{cases}
\]
Now let’s take a minute to consider the domain of each piece.
\(f(x) =|x|\) has a domain of all real numbers. We can input any number we want and get a single output, but we have to be careful with our piecewise definition when we consider \(x=0\). Why? Because 0 is a defined point on both pieces, but we only need to include it once.
If we write the function like this:
\[
f(x) =
\begin{cases}
-x, & \text{if } x \lt 0 \\
x, & \text{if } x \gt 0
\end{cases}
\]
Neither piece includes 0 and the domain is incomplete.
If we write it like this:
\[
f(x) =
\begin{cases}
-x, & \text{if } x \leq 0 \\
x, & \text{if } x \geq 0
\end{cases}
\]
We are not defining a function, because we’re saying that \(f(x)\) equals both \(-x\) and \(x\) at \(x=0\) (even though the output would technically be the same in this case).
Since 0 is in the domain of both pieces, we simply choose which piece to put it in. Both of these equations correctly define the function.
All of our examples so far have depicted piecewise functions with domains of all real numbers. The pieces do not need to connect and they do not need to extend to plus or minus infinity.
Take a look at this function and try to define it with an equation (and yes that single point is a part of it!):
\[
f(x) =
\begin{cases}
x, & -7 < x \leq -3 \\
1, & x = -1 \\
\sqrt{x}, & 0 \leq x < 4 \\
x, & 6 < x \leq 7
\end{cases}
\]
Like other functions, piecewise functions can be used to tell stories. This is the story of a car journey Bob took last week:
\[
d(t) =
\begin{cases}
50t, & 0 \leq t \leq 3 \\
150, & 3 < t < 3.5 \\
25t + 62.5, & 3.5 \leq t < 7.5 \\
250, & 7.5 \leq t < 8 \\
-62.5t, & 8 \leq t \leq 12
\end{cases}
\]
Let’s see how many of these review questions we can answer about Bob’s journey before we go:
How long did the journey last? 12 hrs
What’s the farthest distance Bob drove from his home? 250 mi
How long did it take him to get there? 7.5 hrs
What was Bob doing from 3-3.5 hrs? not moving
When did Bob turn toward home? at the 8 hr mark
When was Bob driving the fastest? from hr 8 to hr 12 he traveled 62.5 mph
What was Bob’s average speed from 0 to 8 hrs? 31.25 mph
Thanks for watching, and happy studying!
Piecewise Function Practice Questions
The following piecewise function shows the speed of a car as a function of time. Daniel says that the flat top portion of the graph shows that the car came to a stop. Is Daniel correct?
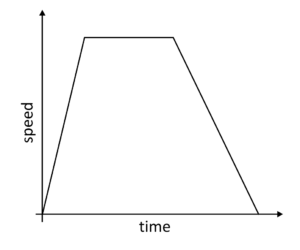
Each “piece” of the graph shows the car traveling at a different speed. The first piece of the graph shows the car gradually increasing speed as time elapses. The second piece of the graph shows the car maintaining a steady speed as time elapses. The third piece of the graph shows the car steadily reducing speed.
Even though the flat piece of the graph seems to show the car stopping, the speed is maintained as time is passing.
What kind of piecewise function is graphed below?
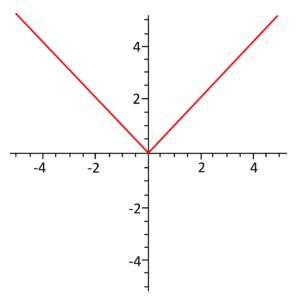
An absolute value function will form a V shape. This type of function is essentially two “pieces” of linear functions.
Define the following piecewise function.
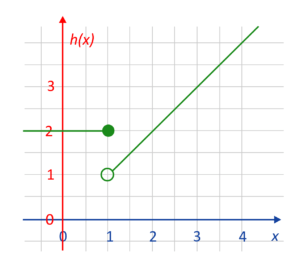
The graph shows that when \(x\) is less than or equal to \(1\), then \(h(x)\) is equal to \(2\). For example, when \(x\) is equal to \(0\), \(h(x)\) equals \(2\). This is defined as \(h(x)=2\text{ if } x>1\).
When x is greater than \(1\), then \(h(x)\) is equal to \(x\). For example, when \(x\) is equal to \(4\), \(h(x)\) is also equal to \(4\). This is defined as \(h(x)=x\text{ if } x>1\).
These two pieces define the piecewise function for the graph:
\(h(x)=2\text{ if } x \leq 1\)
\(x\text{ if } x>1\)
The graph below shows the relationship between time in minutes (\(x\)-axis) and water in gallons (\(y\)-axis). The graph shows the amount of water that was used (in gallons) when George gave his new puppy a bath.
When did George turn the water faucet off? How much water was in the bath when he bathed the puppy?
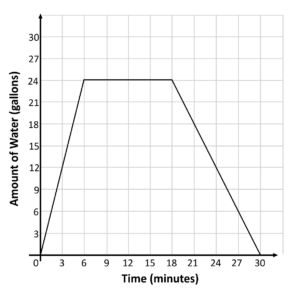
The amount of water in gallons stops increasing when George turns the water faucet off. The \(x\)-axis shows us that when \(6\) minutes have passed, the amount of water stops increasing. This means that George turns off the water after \(6\) minutes, and begins the puppy bath. The \(y\)-axis indicates that at this time the water is currently at \(24\) gallons.
Define the following piecewise function.
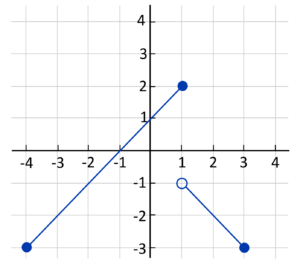
The graphed line on the left side represents \(x\)-values that are greater than or equal to \(-4\), and less than or equal to \(1\). This region can be described as \(-4\leq x\leq 1\). In this region, the \(f(x)\)-value, or \(y\)-value, is always one more than the \(x\)-value. For example, when \(x\) is \(1\), \(y\) is \(2\). When \(x\) is \(-3\), \(y\) is \(-2\). This means that in the region of \(-4\leq x\leq 1\), \(y\) is always one more than \(x\). This is defined as \(f(x)=x+1\hspace{0.25in} -4\leq x\leq 1\).
The graphed line on the right side represents \(x\)-values that are greater than \(1\), and less than or equal to \(3\). This region can be described as \(1 \lt x \leq 3\). In this region, the \(f(x)\)-value, or the \(y\)-value, is always the \(x\)-value negated. For example, when \(x\) is \(2\), \(y\) is \(-2\). When \(x\) is \(3\), \(y\) is \(-3\). This means that in the region of \(1 \lt x \leq 3\), \(y\) is always the negative value of \(x\). This is defined as \(f(x)=-x\hspace{0.25in} 1 \lt x \leq 3\).
When both “pieces” are put together, they define the piecewise function as
\(f(x)=x+1\hspace{0.25in} -4 \leq x \leq 1\)
\(-x\hspace{0.25in} 1 \lt x \leq 3\)