Macroeconomics looks at aggregated markets to gauge the health of the overall economy of a country. To understand overall economic activity, macroeconomists look at macroeconomic indicators and measures including GDP, inflation rate, business cycles, and employment rates.
Each of these measures give some indication of overall economic activity. Essentially they are the economists’ way of taking the economy’s vital signs (temperature, blood pressure, weight, etc.). When looked at all together, they help an economist understand what’s happening in the economy as a whole.
What is GDP?
One of the primary economic indicators is gross domestic product, or GDP for short. GDP is typically defined as the market value of all final goods and services produced within a country in a year. Economists combine the final value of all consumption goods purchased, business investment, government spending, and exports, but subtract imports as an accounting measure to calculate GDP.
Comparing GDP to previous years can give a helpful clue as to whether there is more or less economic activity happening. However, what economists want to know from comparing GDP is whether production changed, not whether prices changed.
Inflation
Inflation is said to occur when the price level rises. Economists measure inflation by analyzing how the prices of a basket of goods changes each year.
Consumer Price Index
The most common measure of inflation in the US is the consumer price index (CPI), which uses a basket of representative consumer goods to estimate price level changes for consumers. Economists compare inflation numbers to understand how the price level is changing.
Real GDP
Since prices can rise (or fall) from year to year, economists use “real GDP”; that is, GDP adjusted for inflation using a price index like CPI, to compare GDP for different years. Using real GDP allows economists to compare GDP over multiple years to see a trend. Is GDP growing? How much is it growing? These comparisons give economists clues to understand overall economic activity.
GDP Per Capita
Economists also use another measure, called real GDP per capita, in which real GDP is divided by a country’s population, to compare output across different countries. While this isn’t a perfect measure, comparisons of real GDP per capita can give some indication of the relative health of different economies, and their changes over time.
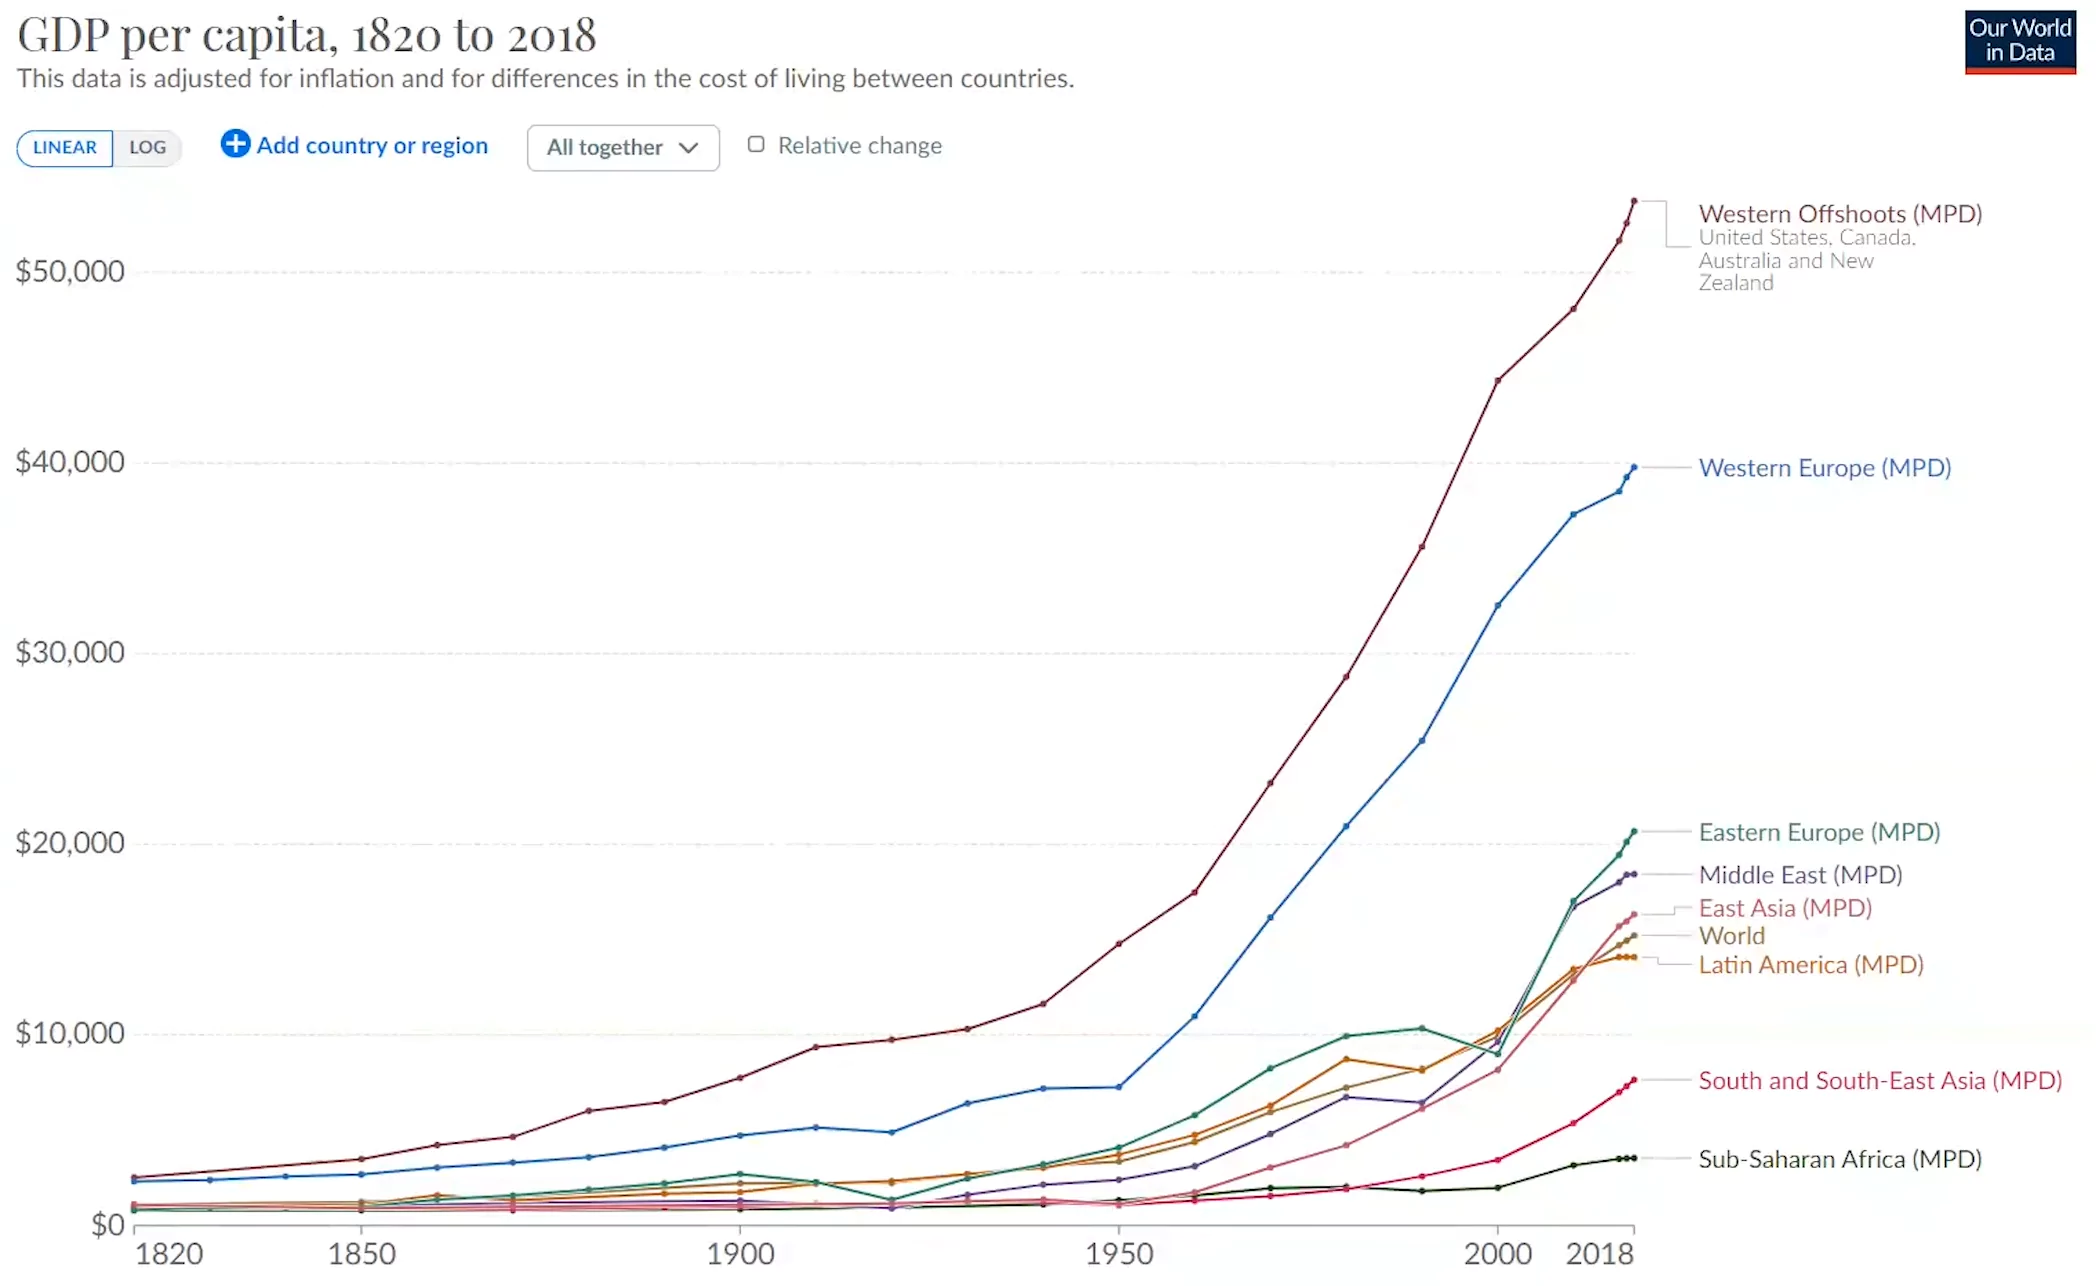
In the last 200 years, GDP per capita has increased as a world average, lifting many out of poverty and, in some countries, has skyrocketed, as you can see in this graph.
This growth in GDP is generally correlated with increasing life expectancy, as well as many other measures of health and well-being, such as increased levels of schooling.
Notice in this graph that you can draw a straight line that connects most of these countries together. That’s the trend line.
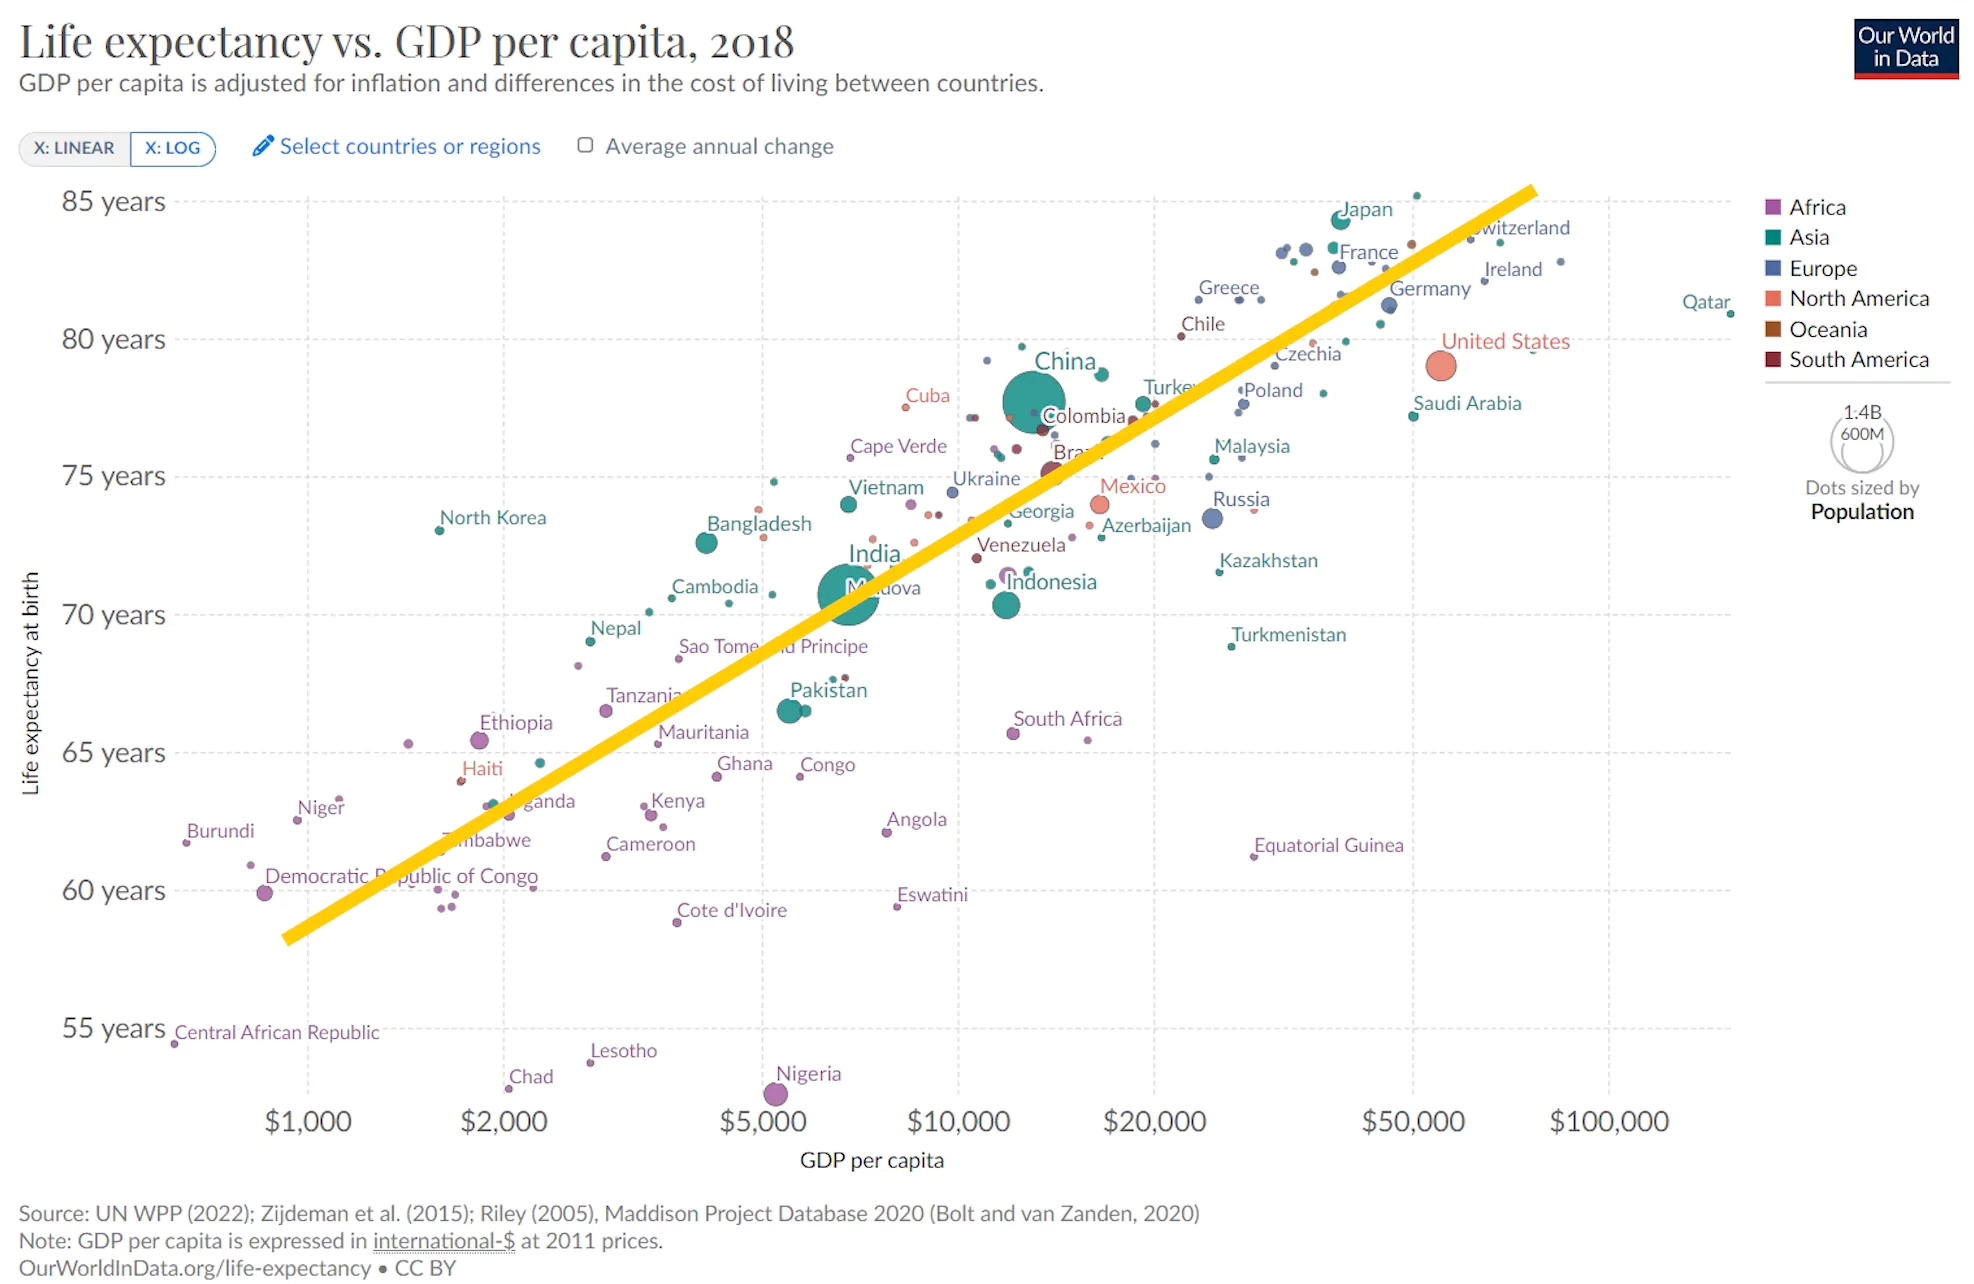
In this case, it goes up. As GDP per capita increases, life expectancy is also likely to increase. This correlation between improved health and wealth conditions is one of the reasons why macroeconomists consider growth rates very important.
Growth rates are measured as a percentage of real GDP. As a country’s real GDP per capita grows, it typically moves closer to the top right corner of the graph, becoming healthier and wealthier.
Steady growth over long periods of time compounds into significant growth in the long run.
Recession
In the short run, however, economic activity typically fluctuates. These fluctuations are commonly referred to as business cycle fluctuations. Economic activity expands, that is, there is economic growth, and then it may be followed by a period of economic contraction, referred to as a recession.
In the US, the National Bureau of Economic Research (NBER) tracks and classifies business cycles. The NBER’s traditional definition of a recession is that it is a significant decline in economic activity that is spread across the economy and that lasts more than a few months.
Prior to 2020, the widespread consensus was that a recession required 2 consecutive quarters of decline in GDP, but due to the significant drop in GDP in March and April, the NBER classified this time as a recession even though it was a shorter time due to the significant drop in economic activity.
Depression
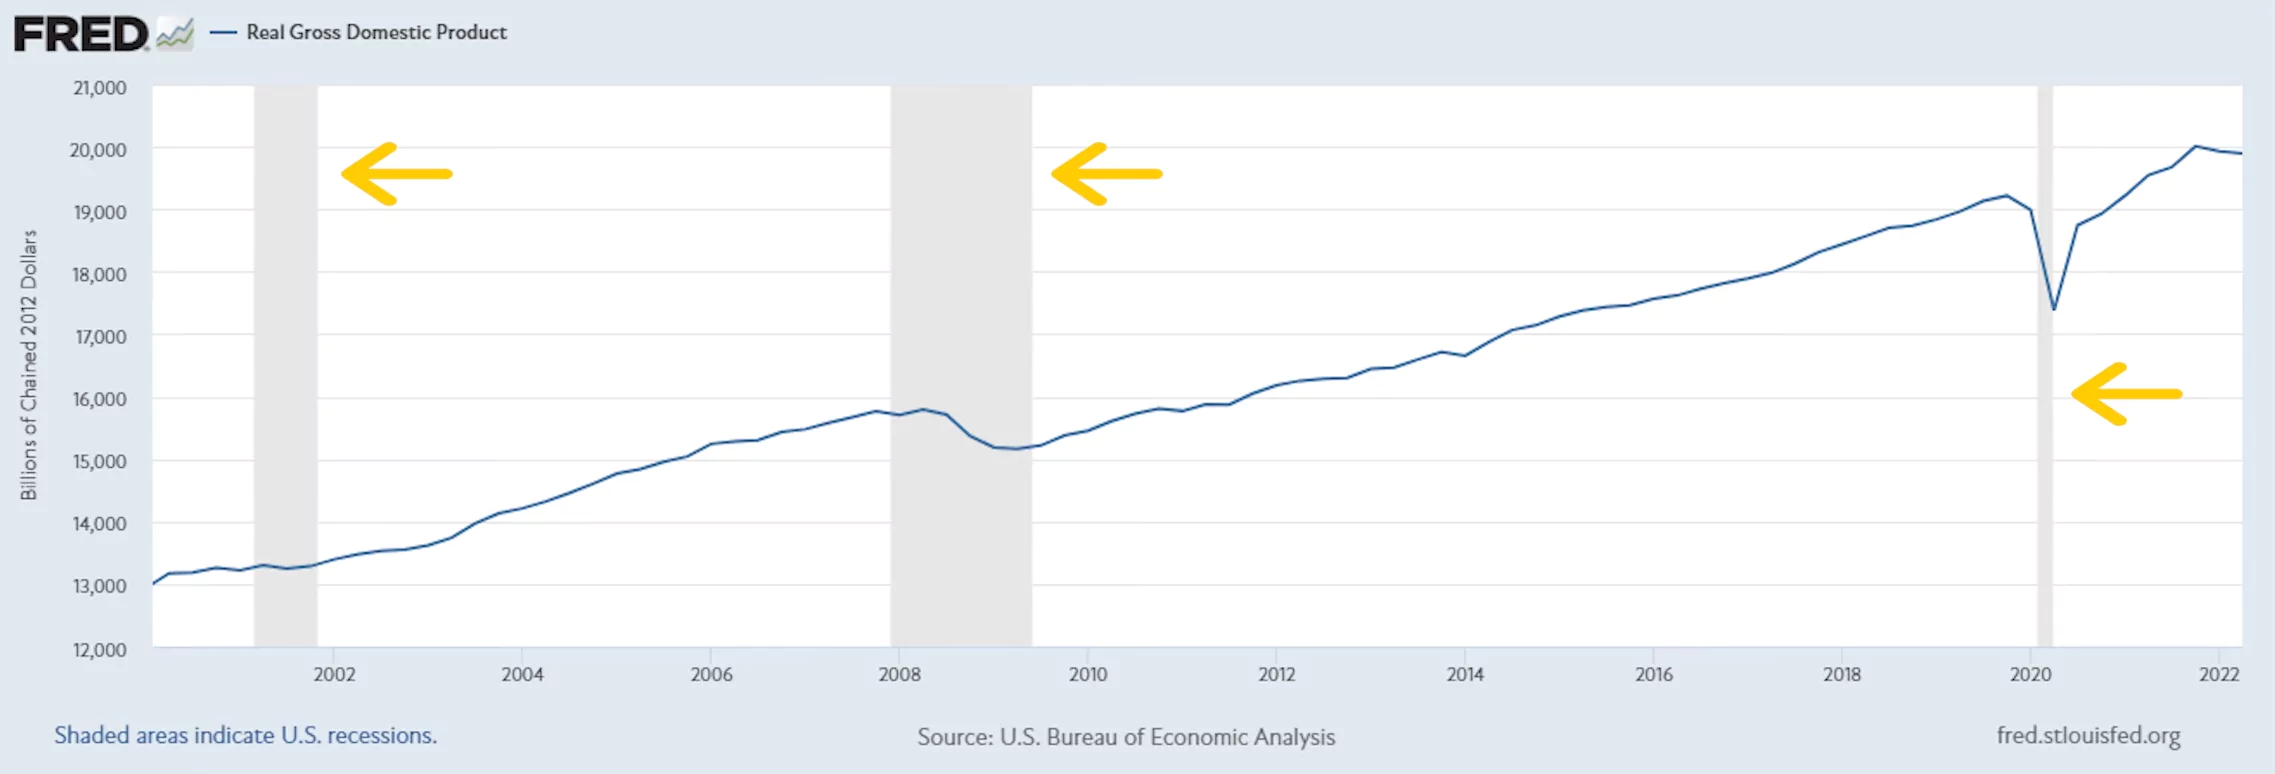
Depressions are even longer and more significant recessions. The NBER dates business cycles by identifying the peak and trough months of economic activity, that is, what were the high and low points of economic activity. As you can see on this graph of real GDP, the gray areas are classified by NBER as recessions, and in each case real GDP is declining.
Employment Rates
Another economic indicator that economists use to diagnose economic health is to examine employment rates. The most common rate looked at is the unemployment rate, that is, how many people are actively looking for work out of the combined total of everyone who is currently working or looking for work.
Notice that we don’t count, for the purposes of the unemployment rate, anyone who is not looking for work or who is ineligible to work (such as anyone under 16, the elderly, voluntary stay-at-home parents or caregivers, anyone incarcerated, etc.). In fact, if you just give up looking for work because you’re so discouraged, you no longer count as unemployed!
Labor Force Participation Rates
So, in addition to looking at the unemployment rate, economists also measure the labor force participation rate. This measure asks how many people are working or actively looking for work in the entire civilian noninstitutional population.
In February of 2020, the labor force participation rate was 63.4% but dropped 3.2 percentage points to 60.2% in April 2020. This is the most drastic drop in the labor force participation rate for the US as reported by FRED, and indicated that the unemployment rate at the time likely UNDERSTATED how many people used to be working but were no longer working due to the pandemic.
Categories of Unemployment
Please note that economists do not ever expect the unemployment rate to be zero! Why? There are different reasons to be unemployed. Economists usually group unemployment into 3 categories: frictional, structural, and cyclical.
Frictional unemployment occurs when workers are looking for work that is a good fit or leave their jobs because they aren’t a good fit. These types of readjustments are natural in a market economy. Note that this type of unemployment includes workers who are just entering the job market, and haven’t found the right job, and individuals who decide to leave a job that is a poor fit in search of a better one.
The second type of unemployment, structural unemployment, is a longer term unemployment that is the result of structural changes in the economy that make it hard for some workers to find new work. In some cases, this is because technology has made a workers’ skillset obsolete.
The third type of unemployment is cyclical unemployment, which is the result of business cycle fluctuations.
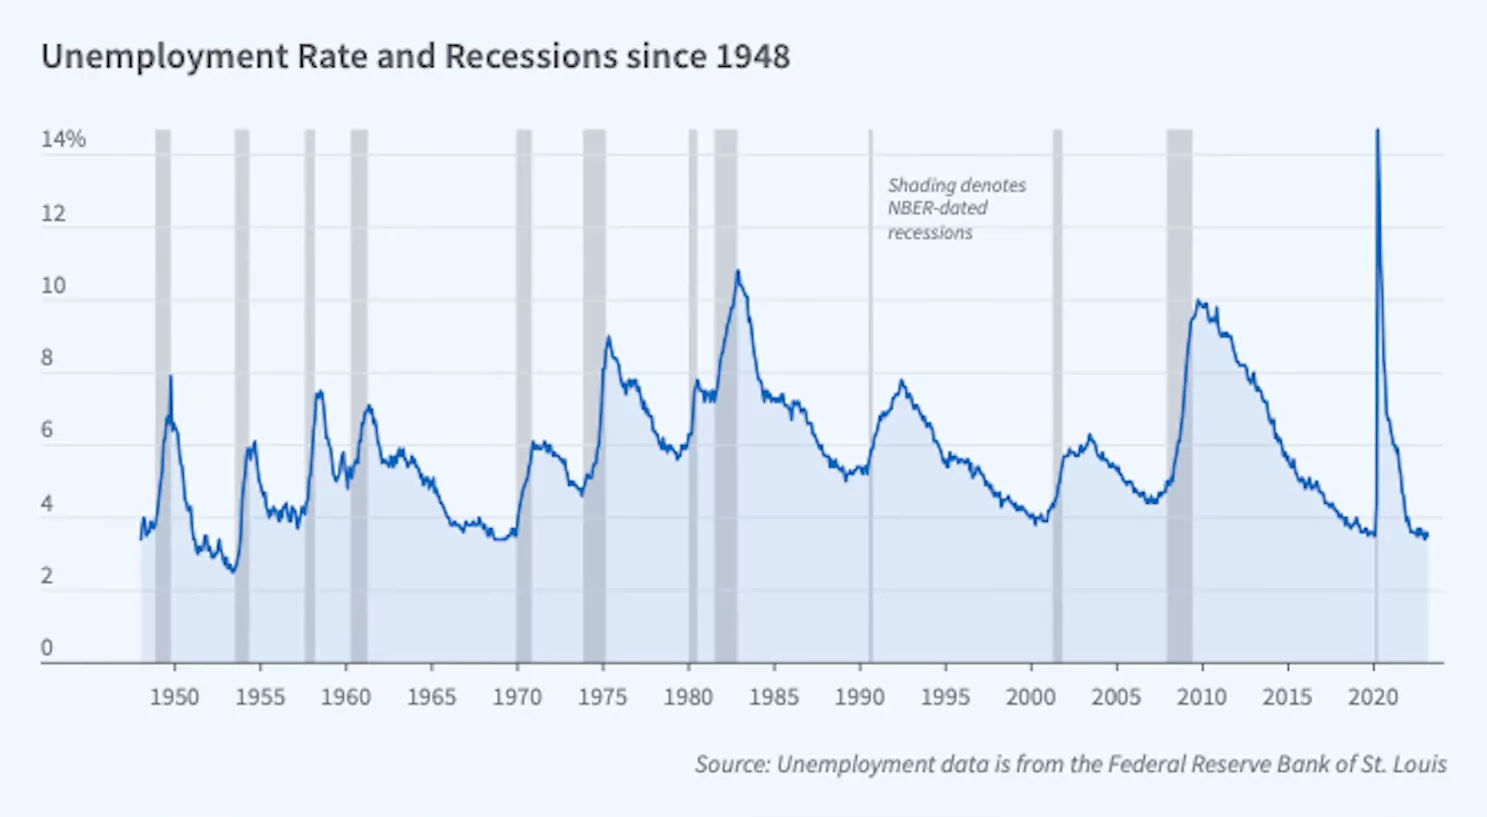
During contractionary periods, not only does GDP decline, but the unemployment rate increases. This is the natural result of businesses cutting back production, thus creating cyclical unemployment. This chart shows the relationship between recessions and the unemployment rate.
By looking at these economic indicators in combination, macroeconomists are able to gauge economic health. GDP fluctuations in the short run, and growth trends in the long run, allow economists to understand and compare output. Unemployment rates can help economists understand whether the economy is recovering from a recession or is continuing to shrink.
That’s all for now. Thanks for watching, and happy studying!