
Hello, and welcome to this video about the manipulation of functions!
Functions can be manipulated, or transformed, to move the graph around the coordinate plane. Today we’ll learn how to translate, stretch, compress, and reflect the graphs of functions.
Reviewing Terms
Before we get started, let’s review a few things.
A function connects an input to an output. Its equation starts with \(f(x)=\)… where \(f\) is the function name, \(x\) is the input, and the expression after the equal sign is the output. An example of this is \(f(x)=2x\). With an input \((x)\) value of 4, the output would be 2(4), which equals 8. We can rewrite the function as \(f(4)=8\).
Graphing Inputs and Outputs
The input and output of a function can be graphed on a coordinate plane from an ordered pair that is written as (input, output), or (\(x, f(x)\)).
Let’s take a look at the graph for the function \(f(x)=2x\):
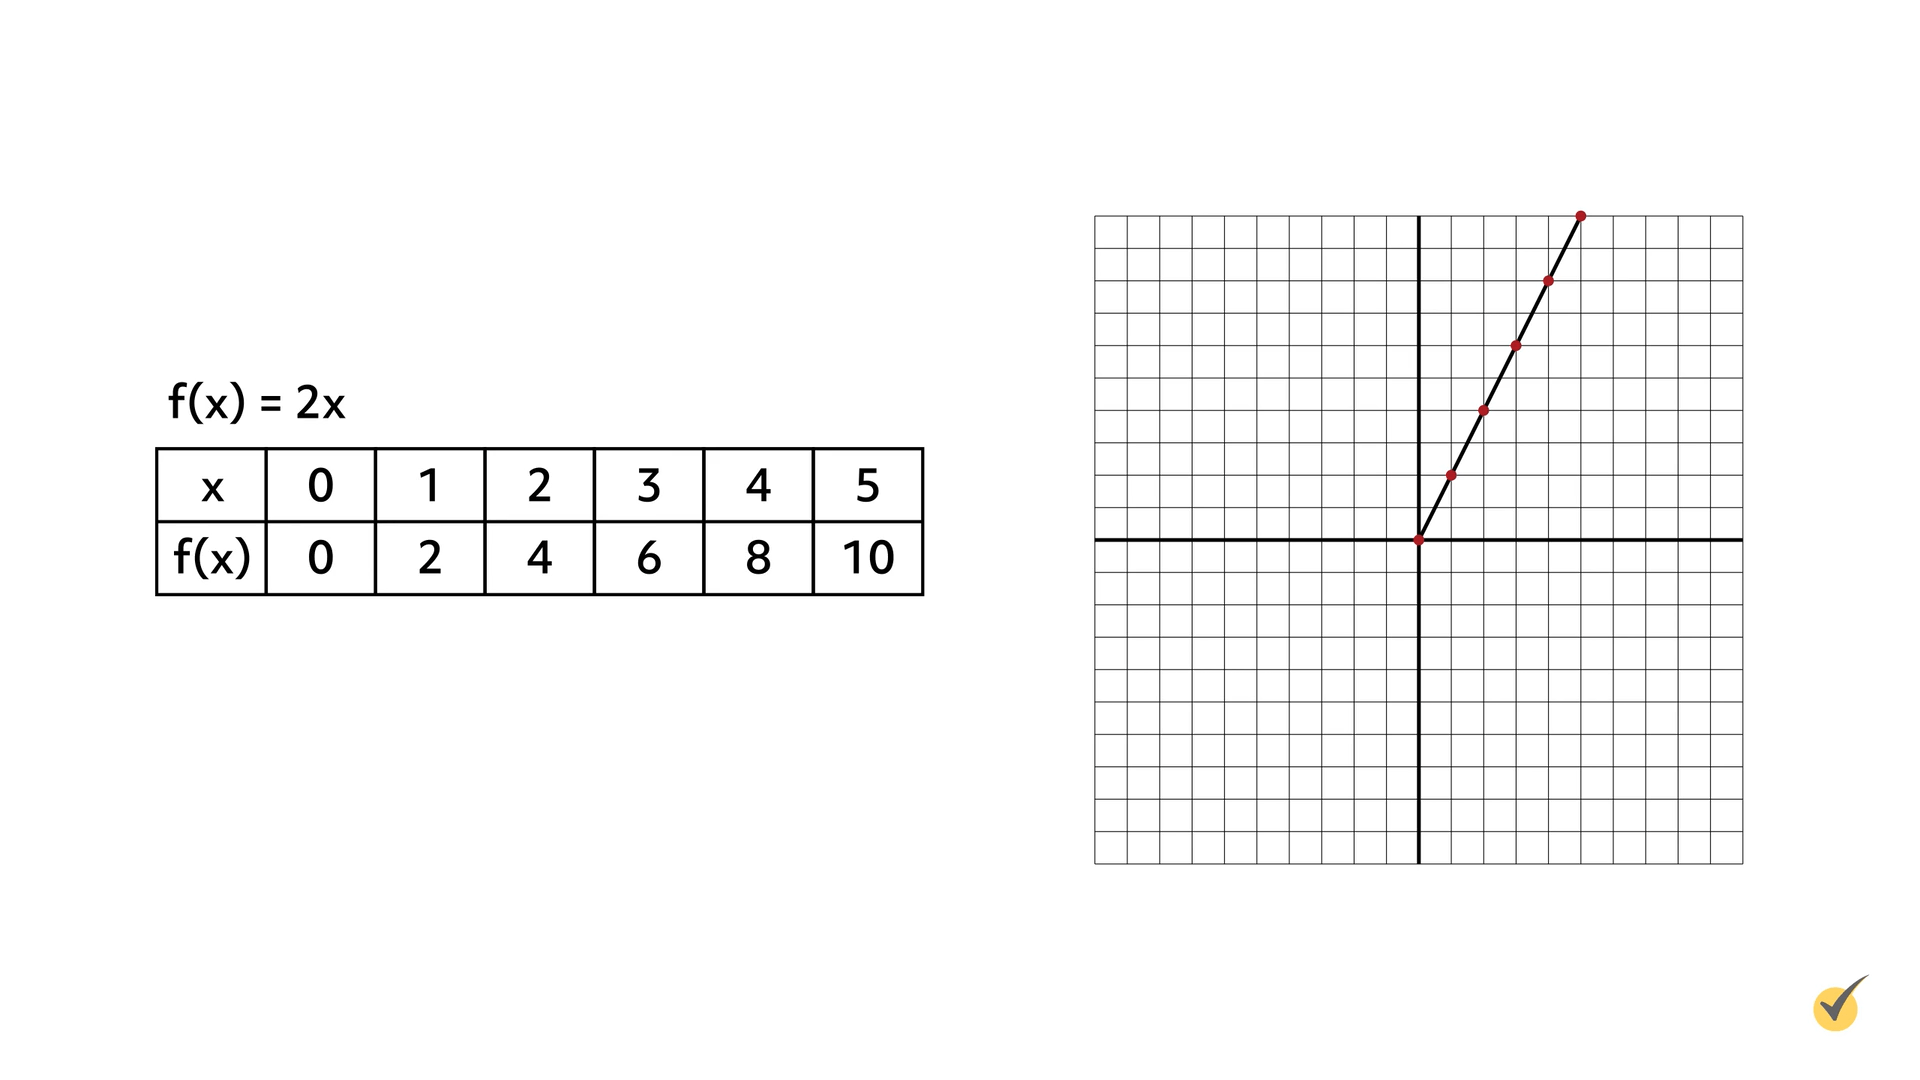
As you can see, this is a linear function because the graph forms a straight line. The \(x\)-axis represents the input, \(x\), and the \(y\)-axis represents the output, \(2x\).
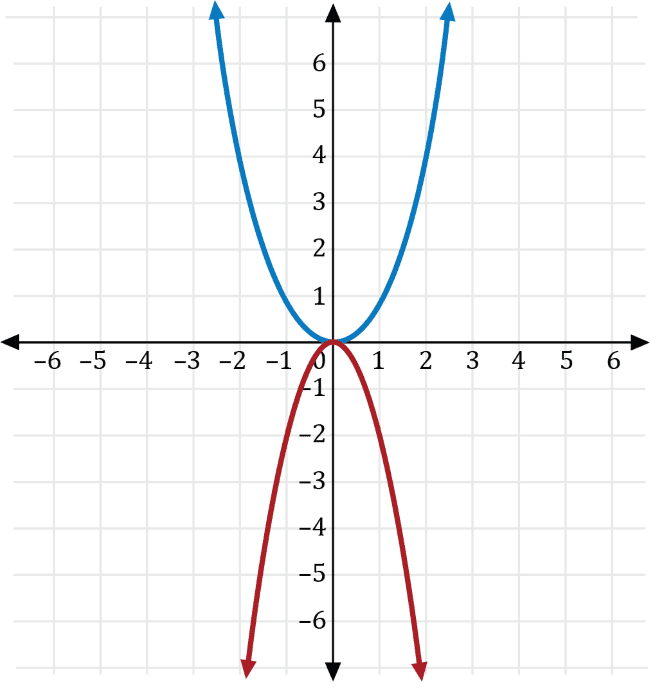
Now let’s take a look at the graph for the function \(f(x)=x^{2}\):
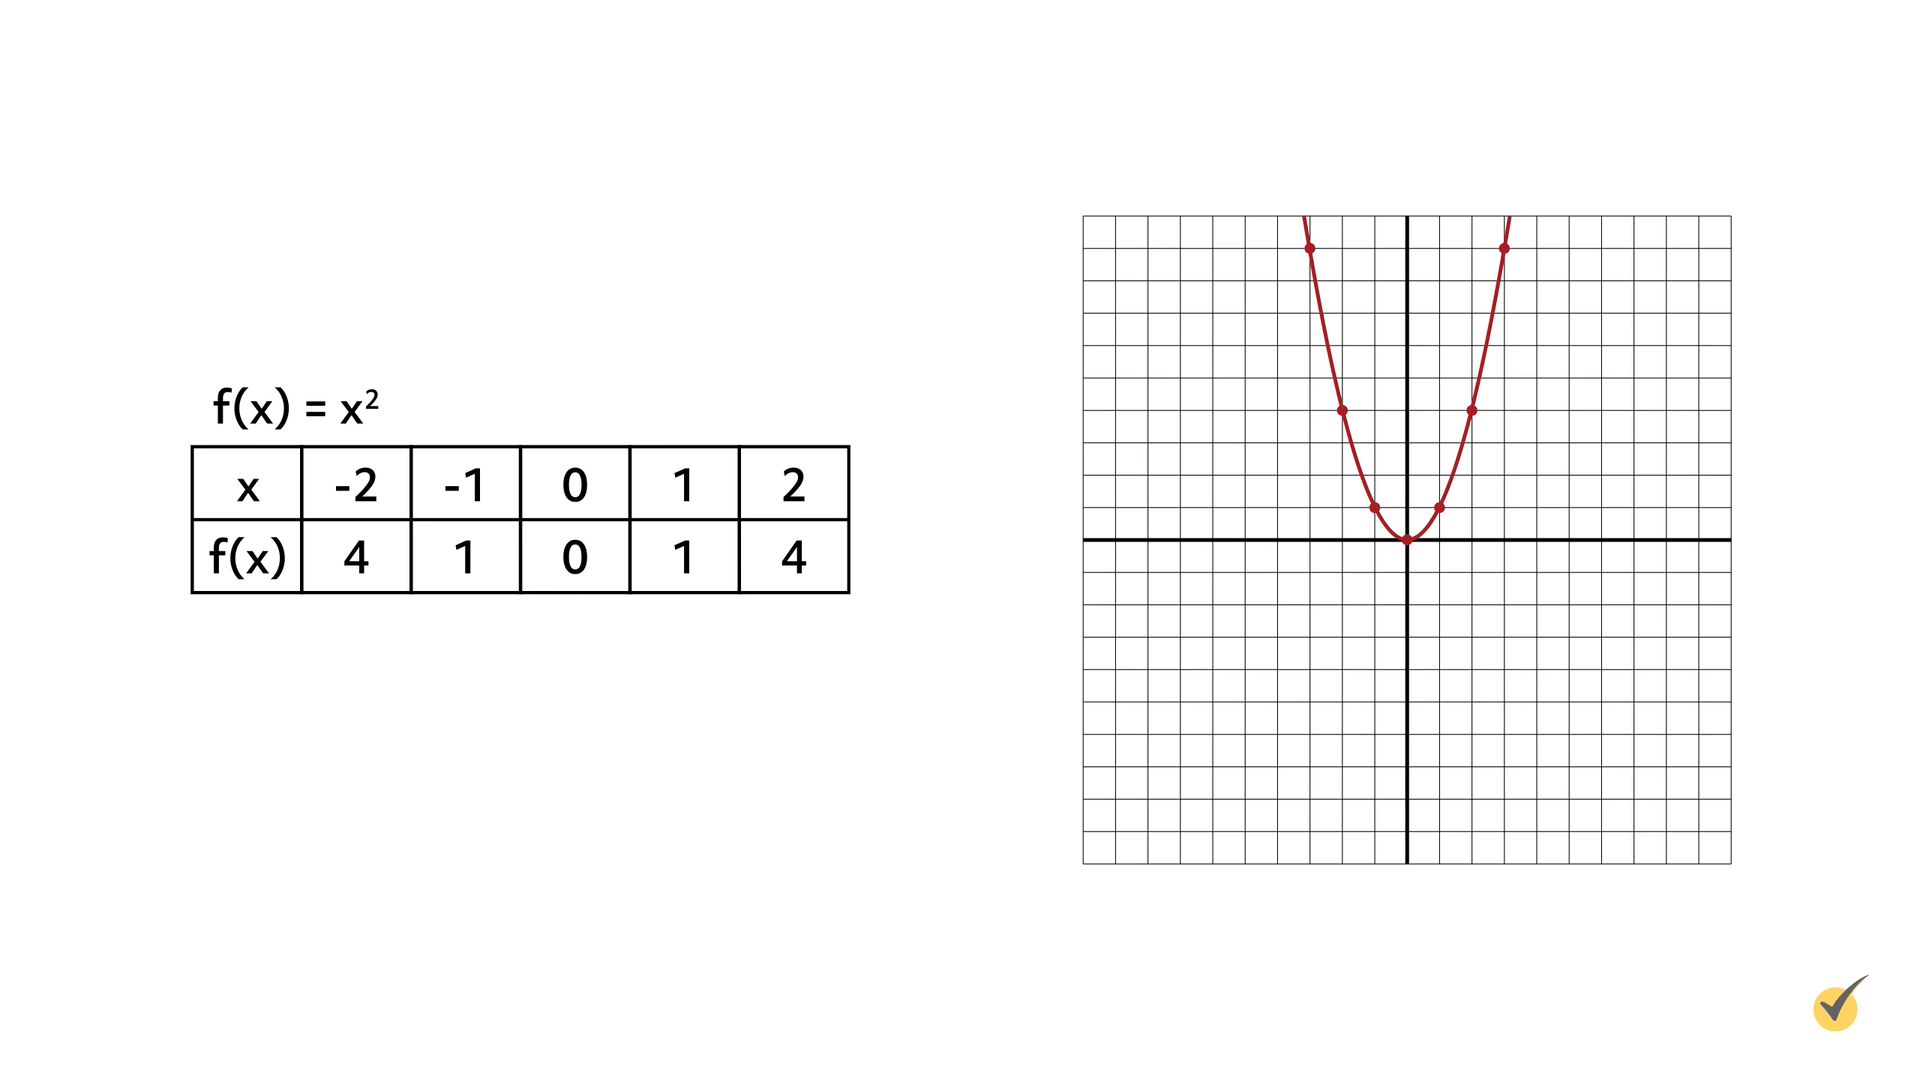
This function is quadratic because its graph forms a u-shape, called a parabola. The \(x\)-axis represents the input, \(x\), and the \(y\)-axis represents the output, \(x^{2}\).
Manipulating a Function
Manipulating a function is the process of altering its equation to move the graph’s position on the coordinate plane. There are lots of ways to manipulate functions.
Let’s start by discussing translations.
Translation
Translating the graph of a function means the entire graph shifts vertically or horizontally. Translations happen when constants are added or subtracted from the \(x\)– or \(y\)-values in the equation.
For vertical translations, adding to the \(y\)-value shifts the graph up, and subtracting from the \(y\)-value shifts it down.
For instance, the translation \(f(x)+3\) moves the graph three units up. Applied to our original function \(f(x)=2x\), the equation would read \(f(x)=2x+3\). Let’s examine how this would affect the graph of this function. Since the graph shifts three units up, the \(y\)-coordinate of the origin point increases by 3. Create a table reflecting this function. The first set of values in the table is 0 and 3 or (0,3).
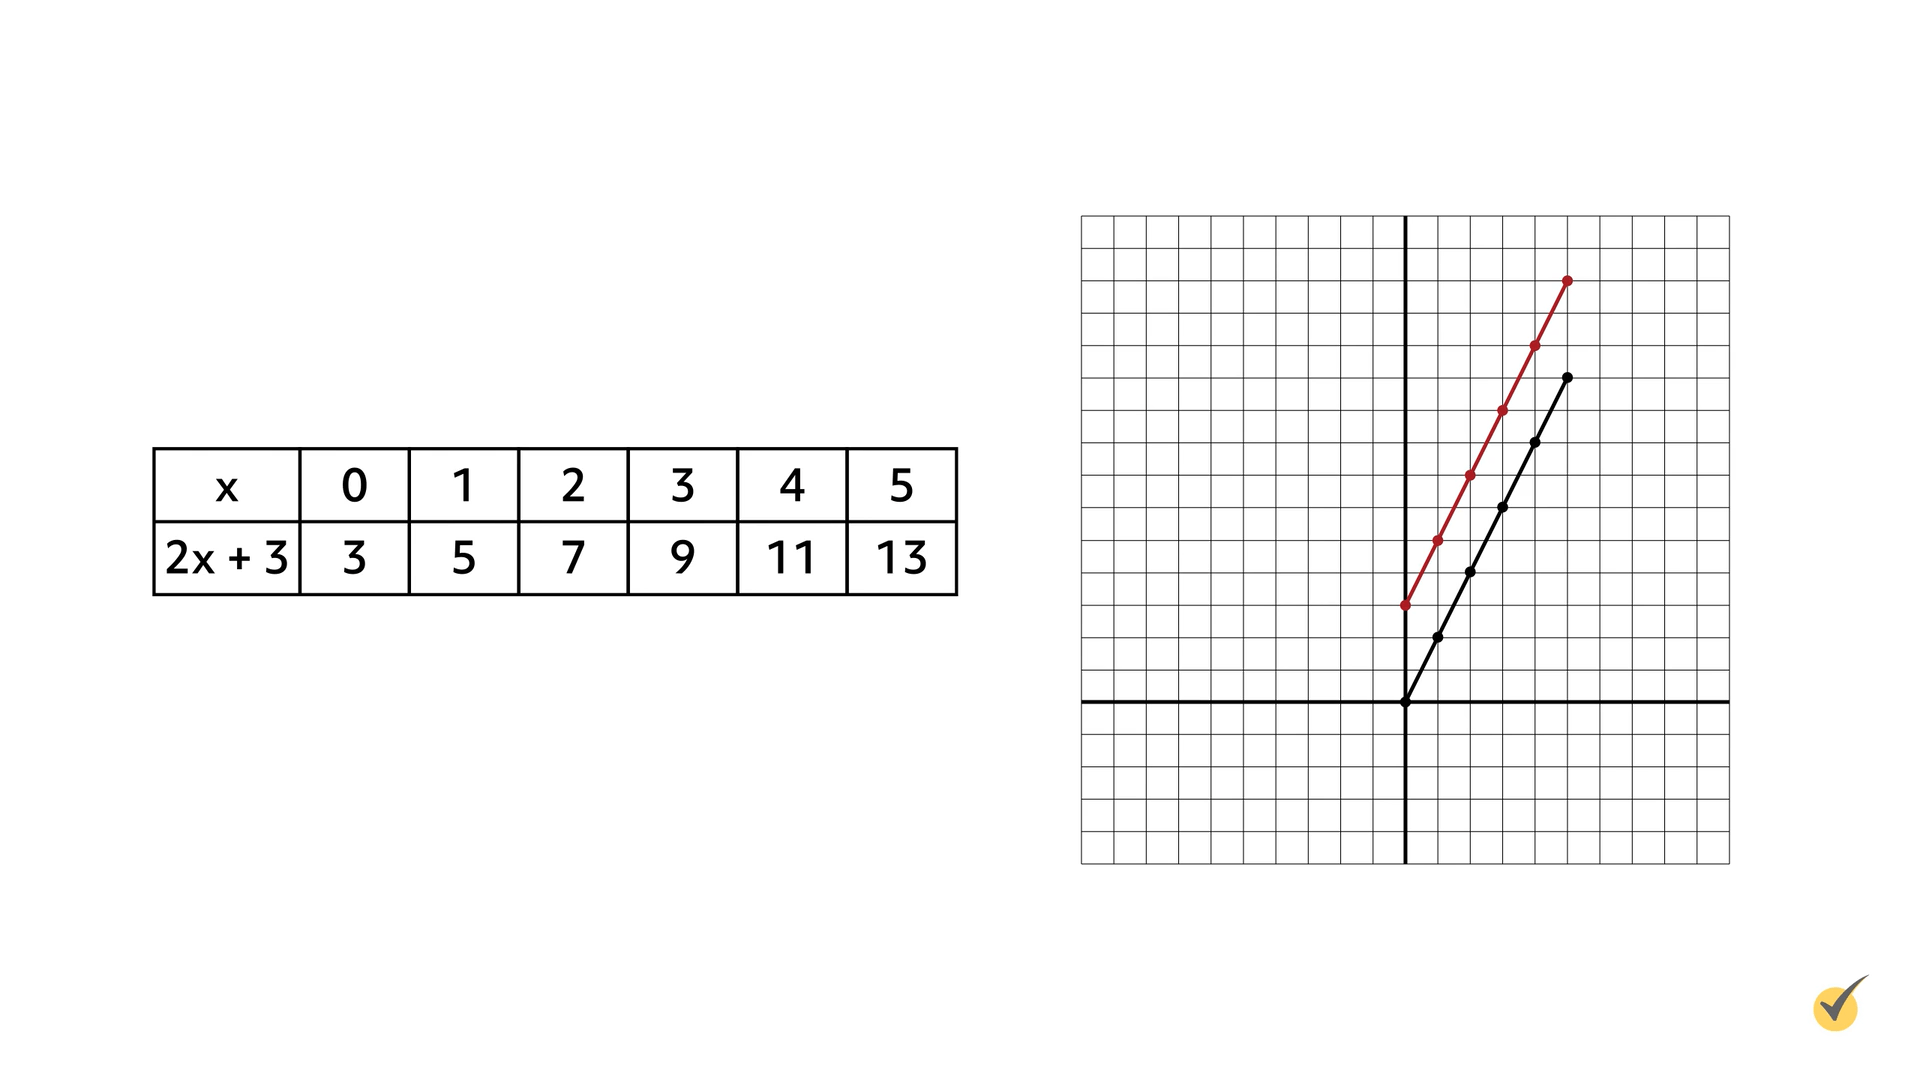
From here, write the rest of the values from the table as ordered pairs and graph them on the coordinate plane: (0, 3); (1, 5); (2, 7); (3, 9); (4, 11); and (5, 13). Each point in the new function \(2x+3\) (shown in red) is three units higher than the original function \(2x\) (shown in black).
Horizontal translations work a little bit differently. They are indicated inside the parentheses of the function. For horizontal translations, adding to the \(x\)-value shifts the graph to the left, and subtracting from the \(x\)-value shifts the graph to the right. In other words, horizontal shifts move in the opposite direction of the change.
To illustrate this point, we will translate the graph of our original function \(f(x)=2x\) five units to the right. First, rewrite the equation reflecting this translation by subtracting 5 from the \(x\)-value inside parentheses: \(f(x)=2(x-5)\). Next, complete a table showing the new values for this function:
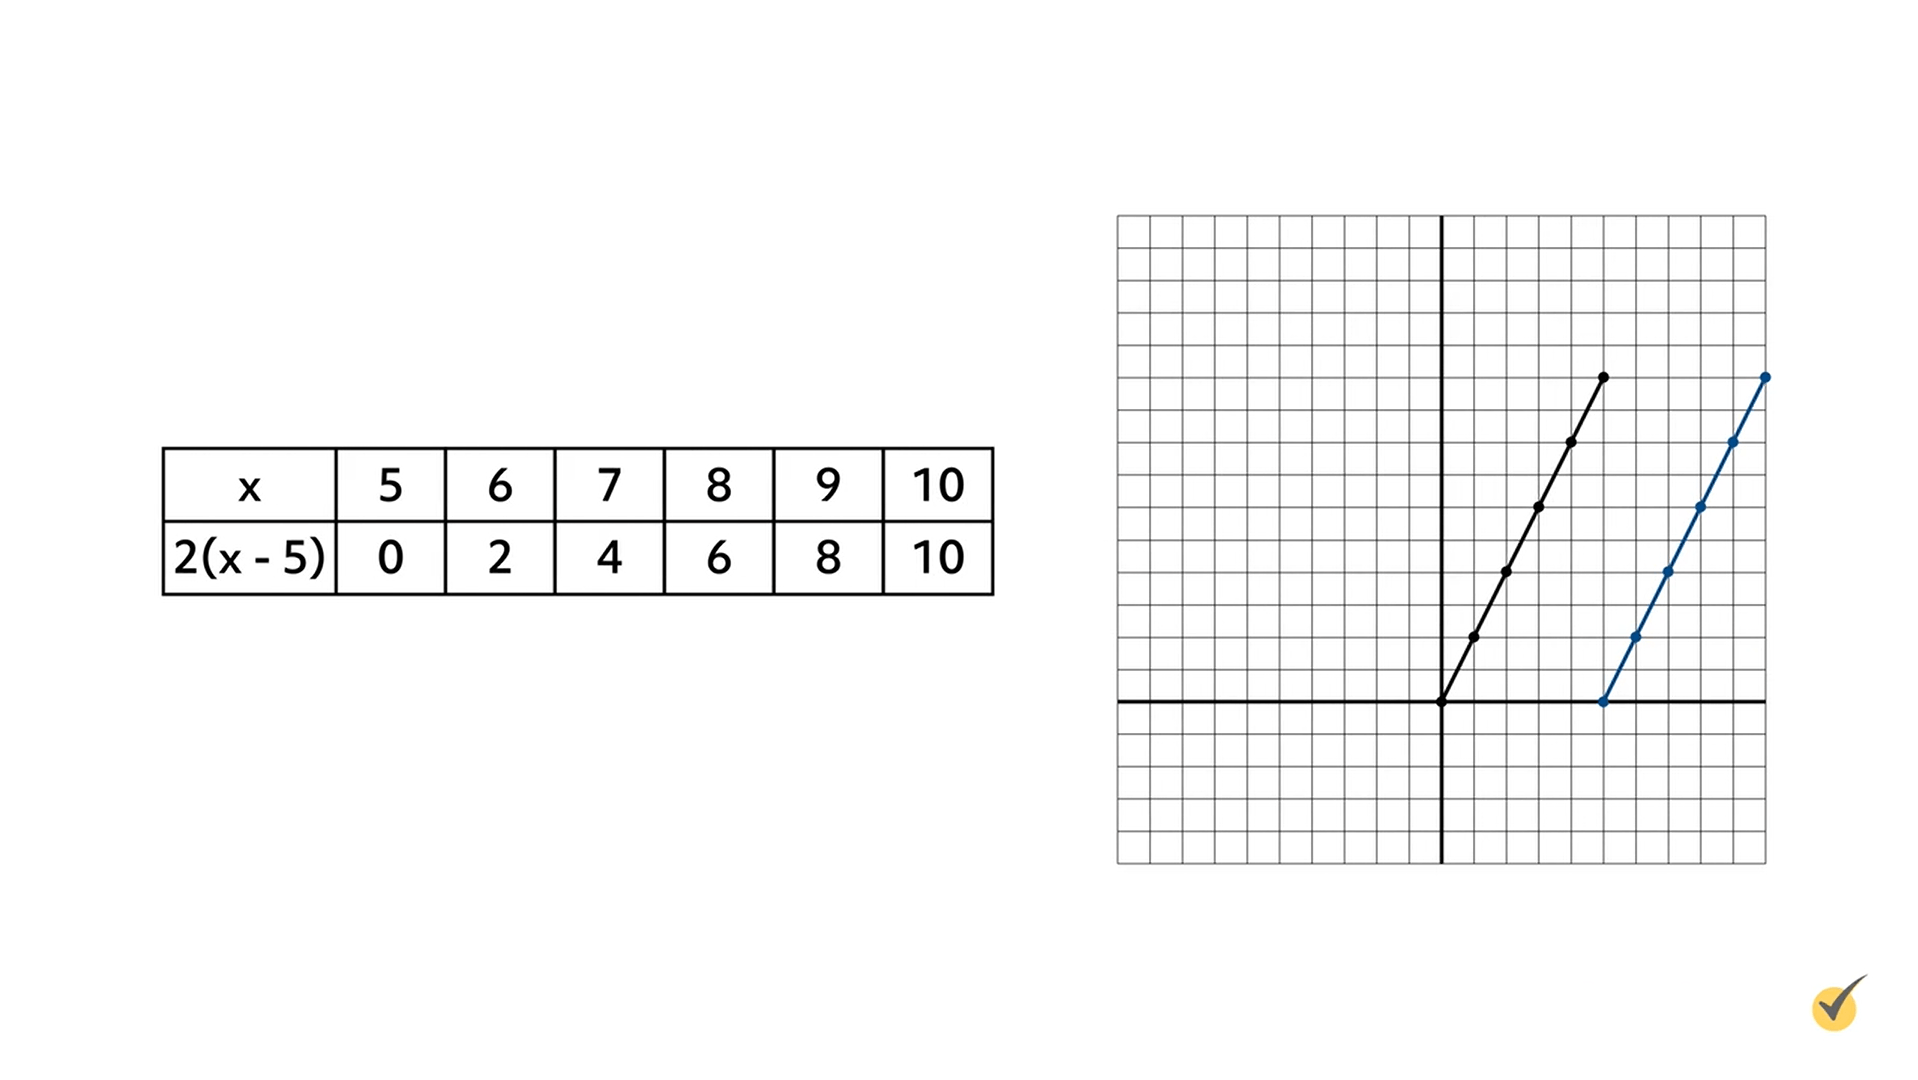
Since the graph shifted five units to the right, the \(x\)-coordinate of the origin point increased by 5. Therefore, the first set of values in the tables are 5 and 0 or (5, 0).
From here, write the rest of the values from the table as ordered pairs and graph them on the coordinate plane: (5, 0); (6, 2); (7, 4); (8, 6); (9, 8); and (10, 10). In the graph, the original function \(f(x)=2x\) is graphed in black, and the new function \(f(x)=2x-5\) is graphed in blue. The \(x\)-axis represents the values for \(x\) and the \(y\)-axis represents the values for \(2(x-5)\).
Let’s take a look at one more translation. This time we’ll translate the function \(f(x)=2x\) four units to the left and six units down.
First, rewrite the equation to reflect this translation by subtracting 6 from the \(y\)-value outside the parentheses and adding 4 units to the \(x\)-value inside the parentheses: \(f(x)=(2(x+4))-6\). Next, complete a table showing the new values for this function:
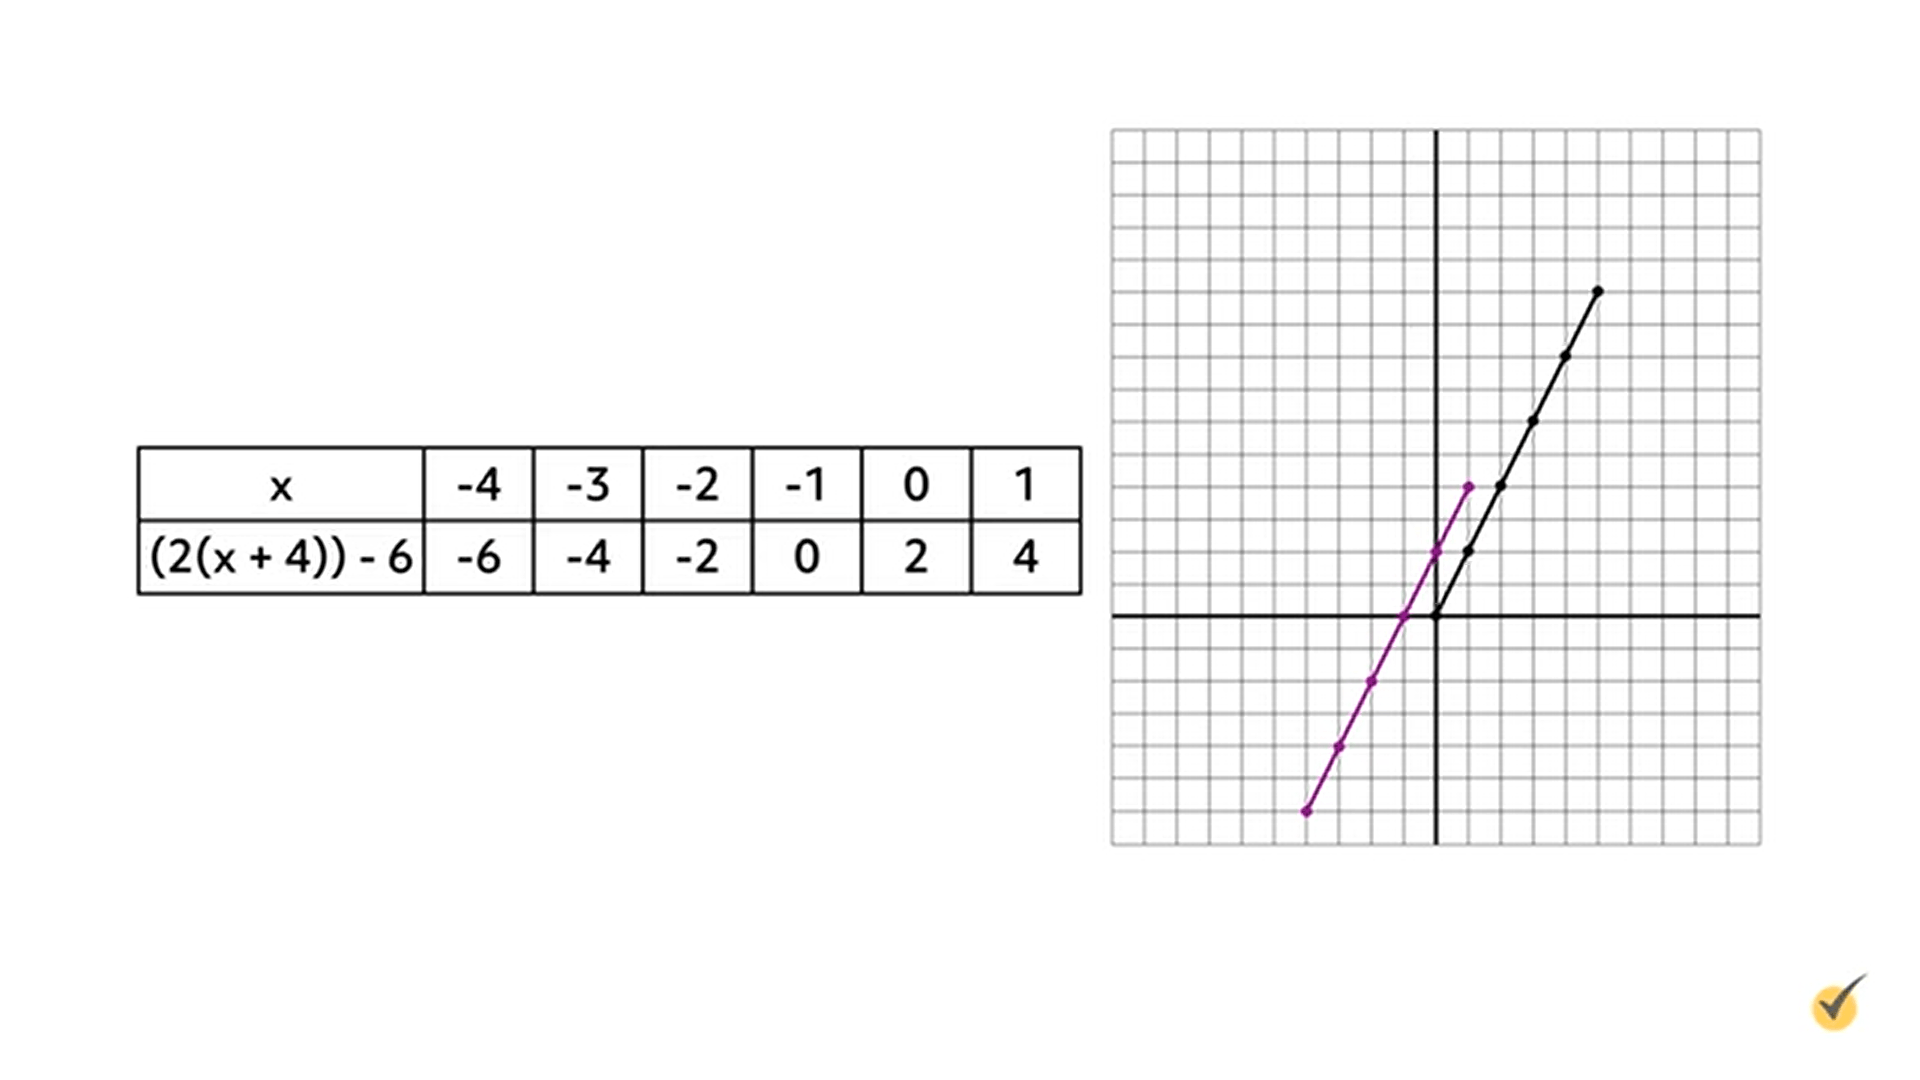
Since the graph shifts four units to the left, the \(x\)-coordinate of the origin point decreased by 4. Since the graph shifts six units down, the \(y\)-coordinate of the origin point decreased by 6. The first set of values in the table are -4 and -6, or (-4, -6).
From here, write the rest of the values from the table as ordered pairs and graph them on the coordinate plane: (-4, -6); (-3, -4); (-2, -2); (-1, 0); (0, 2); and (1, 4). On the coordinate plane, the original function \(f(x)=2x\) is graphed in black, and the new function \(f(x)=(2(x+4))-6\) is graphed in purple. The \(x\)-axis represents the values for \(x\) and the \(y\)-axis represents the values for \((2(x+4))-6\).
Now it’s your turn. I’m going to give you a chance to practice what you’ve just learned about translations. When you see the practice problem, pause the video and solve it. Once you’re ready, resume the video and we’ll go over the answer together.
Ready? Here we go. The function \(f(x)=6x+8\) is shifted 3 units to the right and 5 units down. Write an equation to represent these changes.
How’d you do? Let’s take a look at the problem together. Since the function shifts 3 units to the right, subtract 3 from the \(x\)-value in parentheses. Rewrite the function as \(f(x)=6(x-3)+8\). Next, subtract 5 from the entire function to move 5 units down. The correct equation is \(f(x)=(6(x-3)+8)-5\).
Stretch and Compression
Another way to manipulate the graphs of functions is by stretching or compressing them. Vertical stretching happens when the function as a whole gets multiplied by a constant (\(k\)) greater than 1, using the formula \(k\times f(x)\).
Let’s stretch the function \(f(x)=x^{2}\) vertically by the constant (\(k\)) 3. Start by graphing the original function, \(f(x)=x^{2}\), shown as a solid line on the coordinate plane. When this function is multiplied by 3, the graph stretches vertically. The stretched graph appears as a dashed line on the coordinate plane.
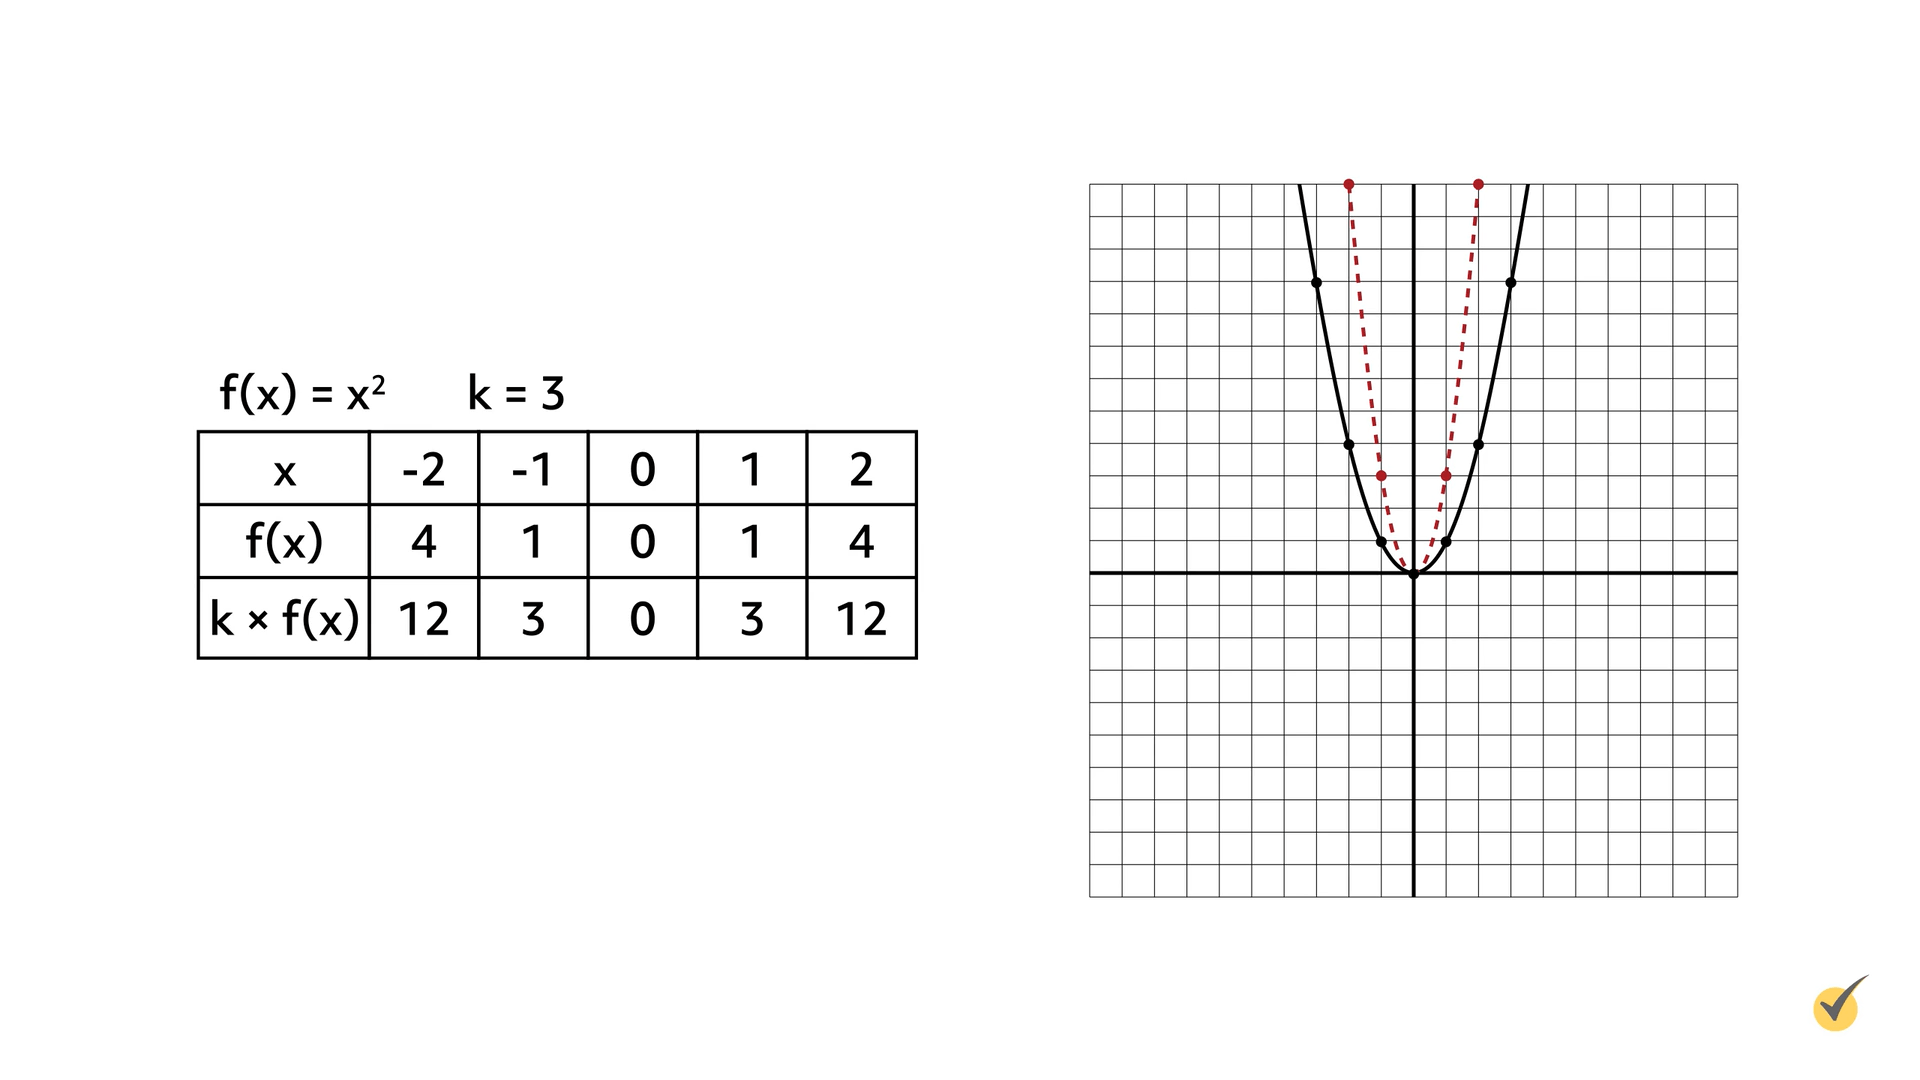
A graph is stretched vertically, in relation to the graph of the original function, when the \(y\)-coordinates are multiplied by a value greater than 1.
If the value of the constant (\(k\)) is greater than 0 but less than 1, then the graph is compressed vertically. Let’s compress the function \(f(x)=x^{2}\) vertically by using \(\frac{1}{2}\) for the constant (\(k\)). Start by graphing the original function, which is shown on the graph in red. When the function is multiplied by \(\frac{1}{2}\), the graph is compressed vertically. This is shown on the coordinate plane in green.
Multiplying the \(y\)-coordinates by a value greater than 0 but less than 1 compresses the graph vertically in relation to the graph of the original function.
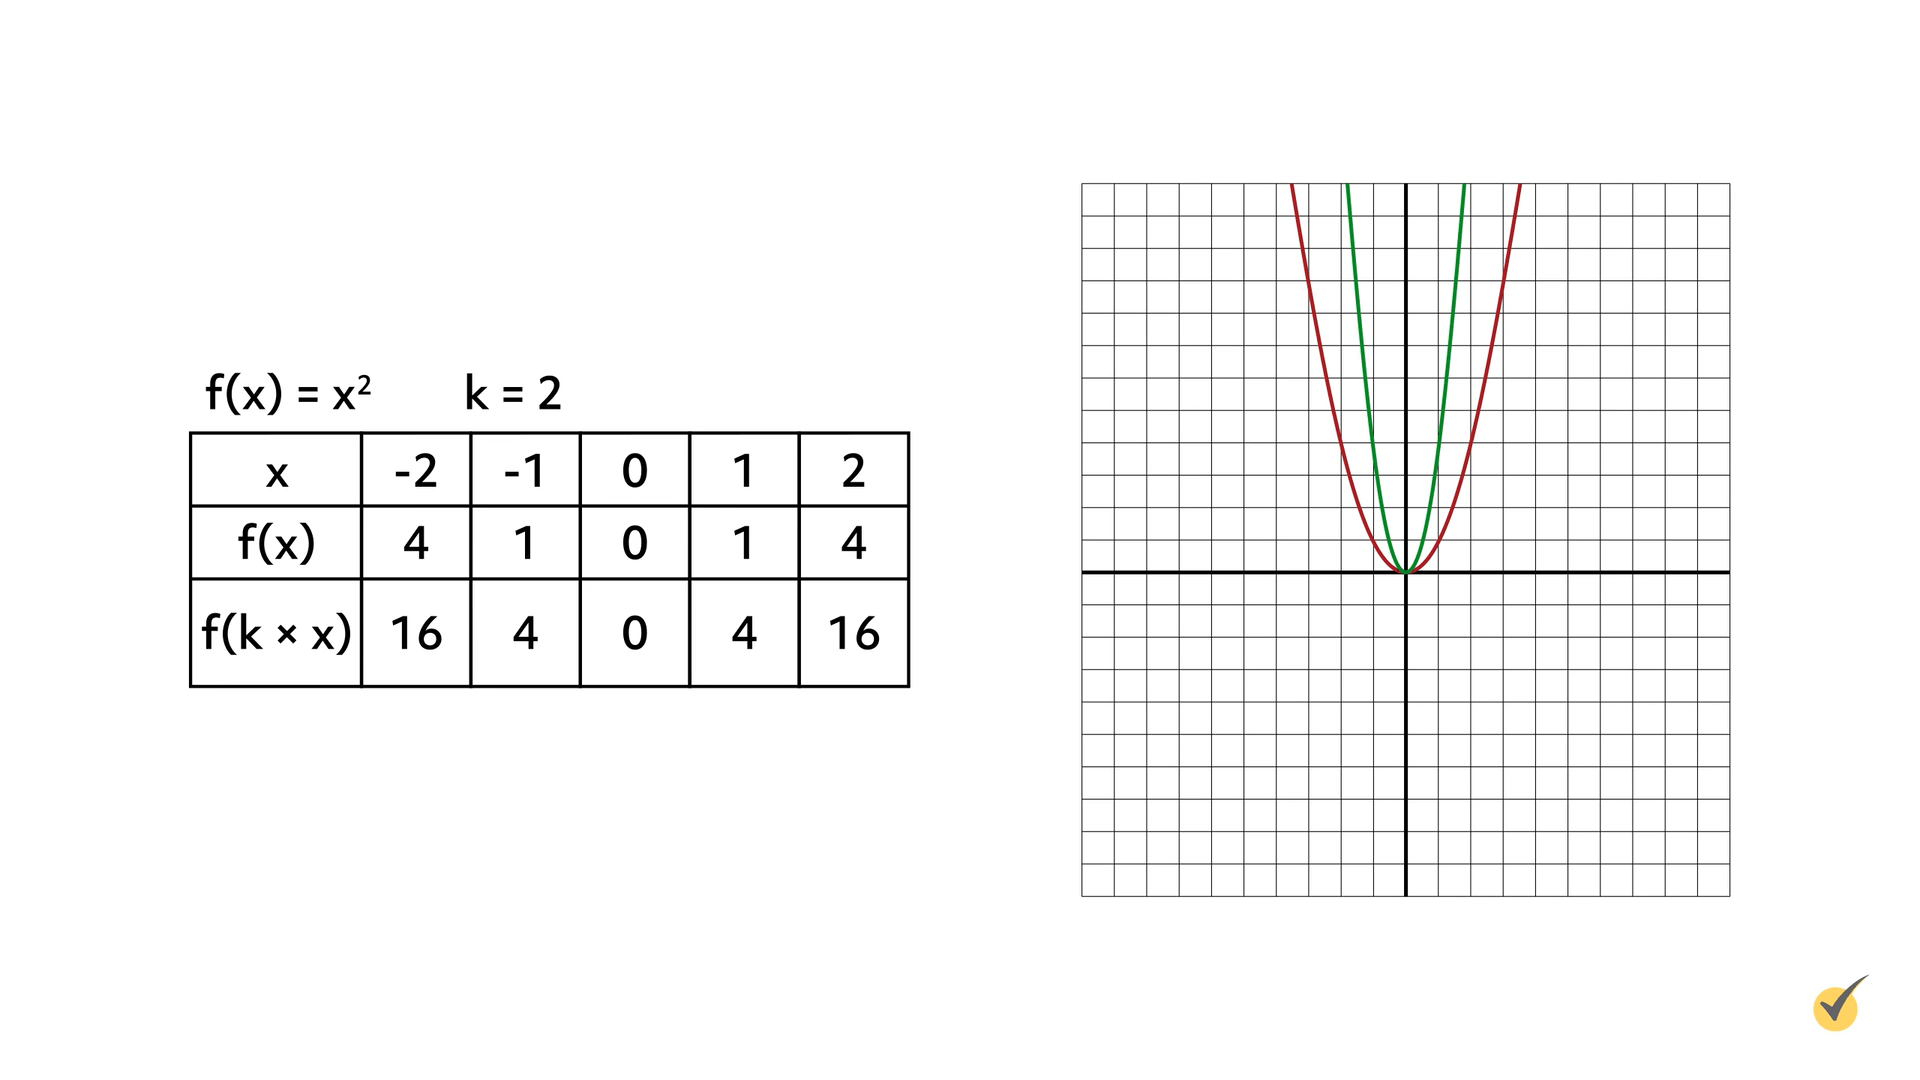
A function can also stretch and compress horizontally. Horizontal compression happens when the \(x\)-value is multiplied by a constant (\(k\)) greater than one, \(f(k\times x)\).
Let’s compress the function \(f(x)=x^{2}\) horizontally by the constant (\(k\)) 2. As always, start by graphing the original function, which is shown on the coordinate plane in red. The graph of \(f(x)=(2x)^{2}\), shown in green, is a horizontal compression of \(f(x)=x^{2}\) by a factor of 2.
In relation to the graph of the original function, a graph is compressed when the \(x\)-value is multiplied inside parentheses by a value greater than 1.
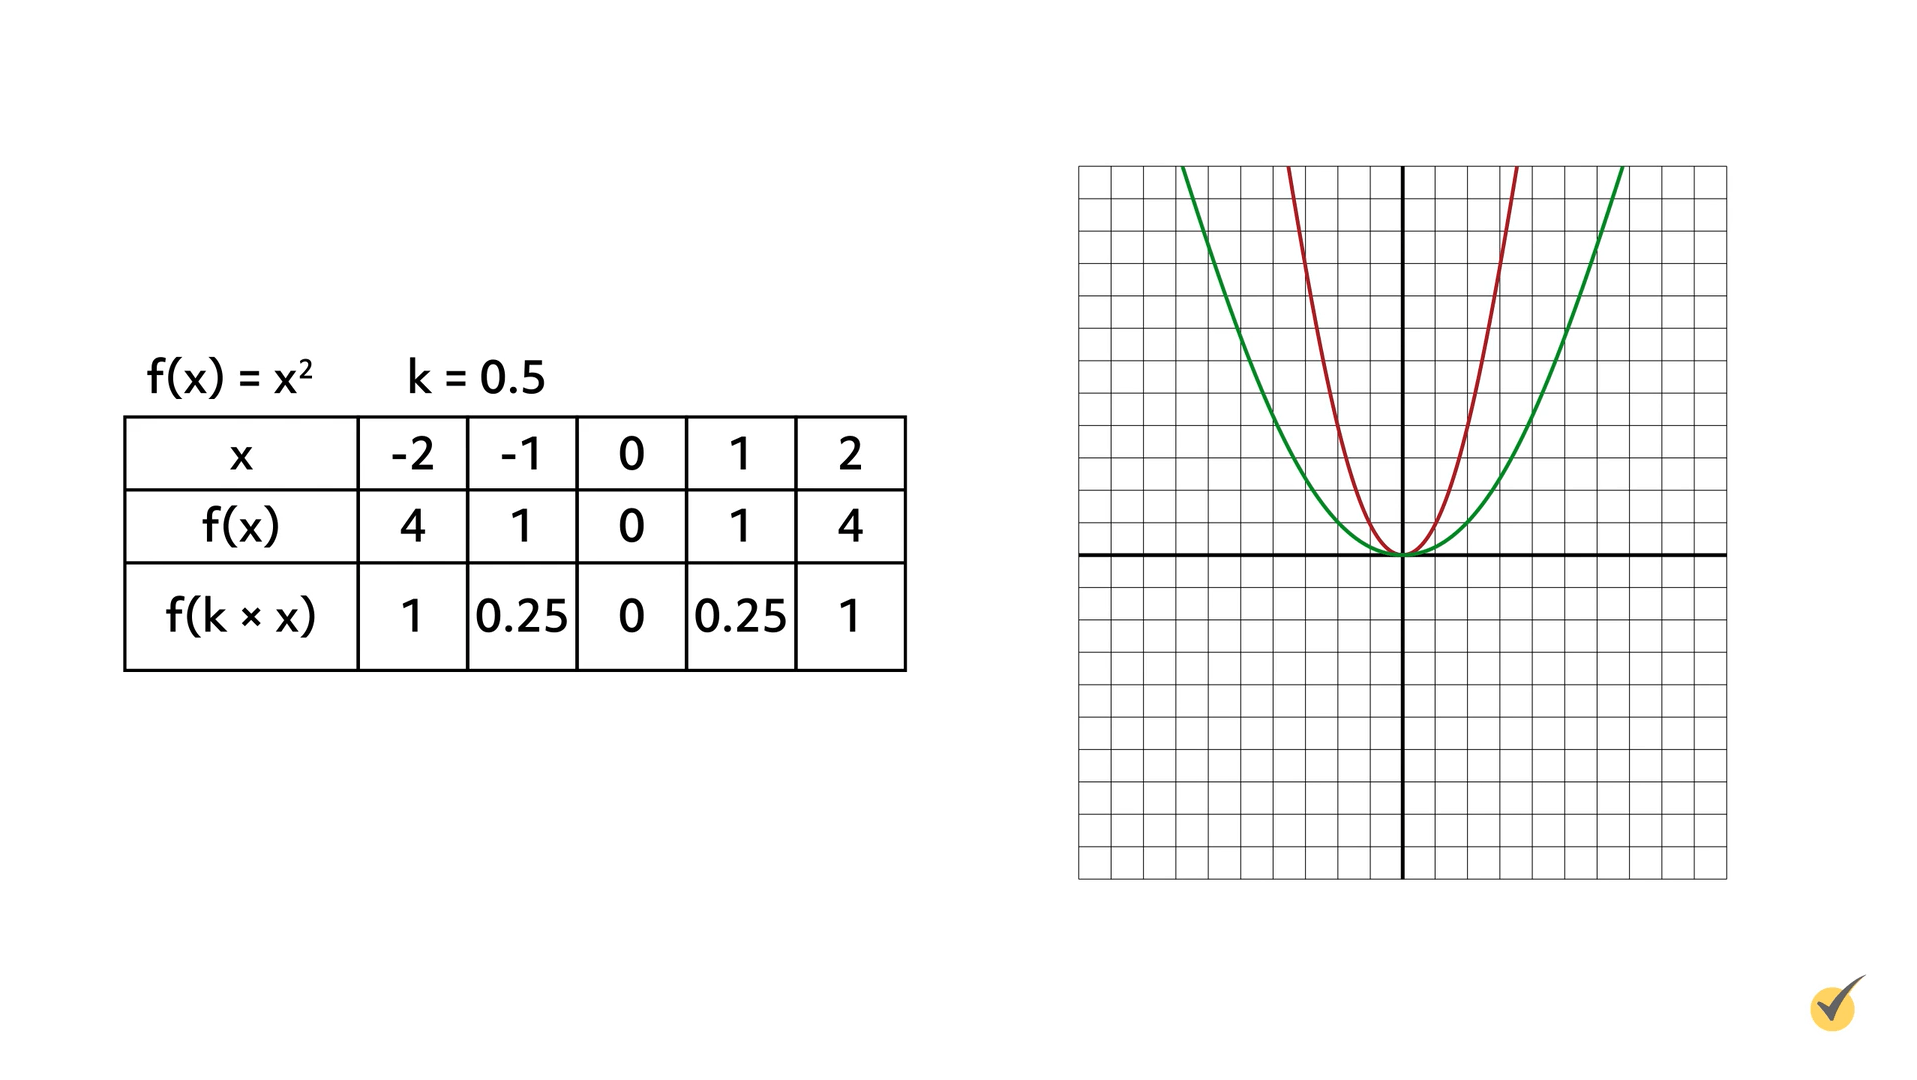
A function stretches horizontally when the \(x\)-value is multiplied by a constant (\(k\)), using the formula \(f(k\times x)\). The value of \(k\) must be greater than 0 but less than 1.
Let’s stretch the function \(f(x)=x^{2}\) horizontally by the constant (\(k\)) 0.5. The original function is graphed in red. The graph of \(f(x)=(0.5x)^{2}\), which stretches the function horizontally by a factor of 2, is shown in green.
Multiplying the \(x\)-value inside parentheses by a value greater than 0 but less than 1 stretches the graph horizontally in relation to the graph of the original function.
Reflection
Another way to manipulate functions is by reflecting them across the \(x\)– or \(y\)-axis. Reflections can be thought of as flipping the graph of a function over an axis. When reflected, the new graph is congruent to the original.
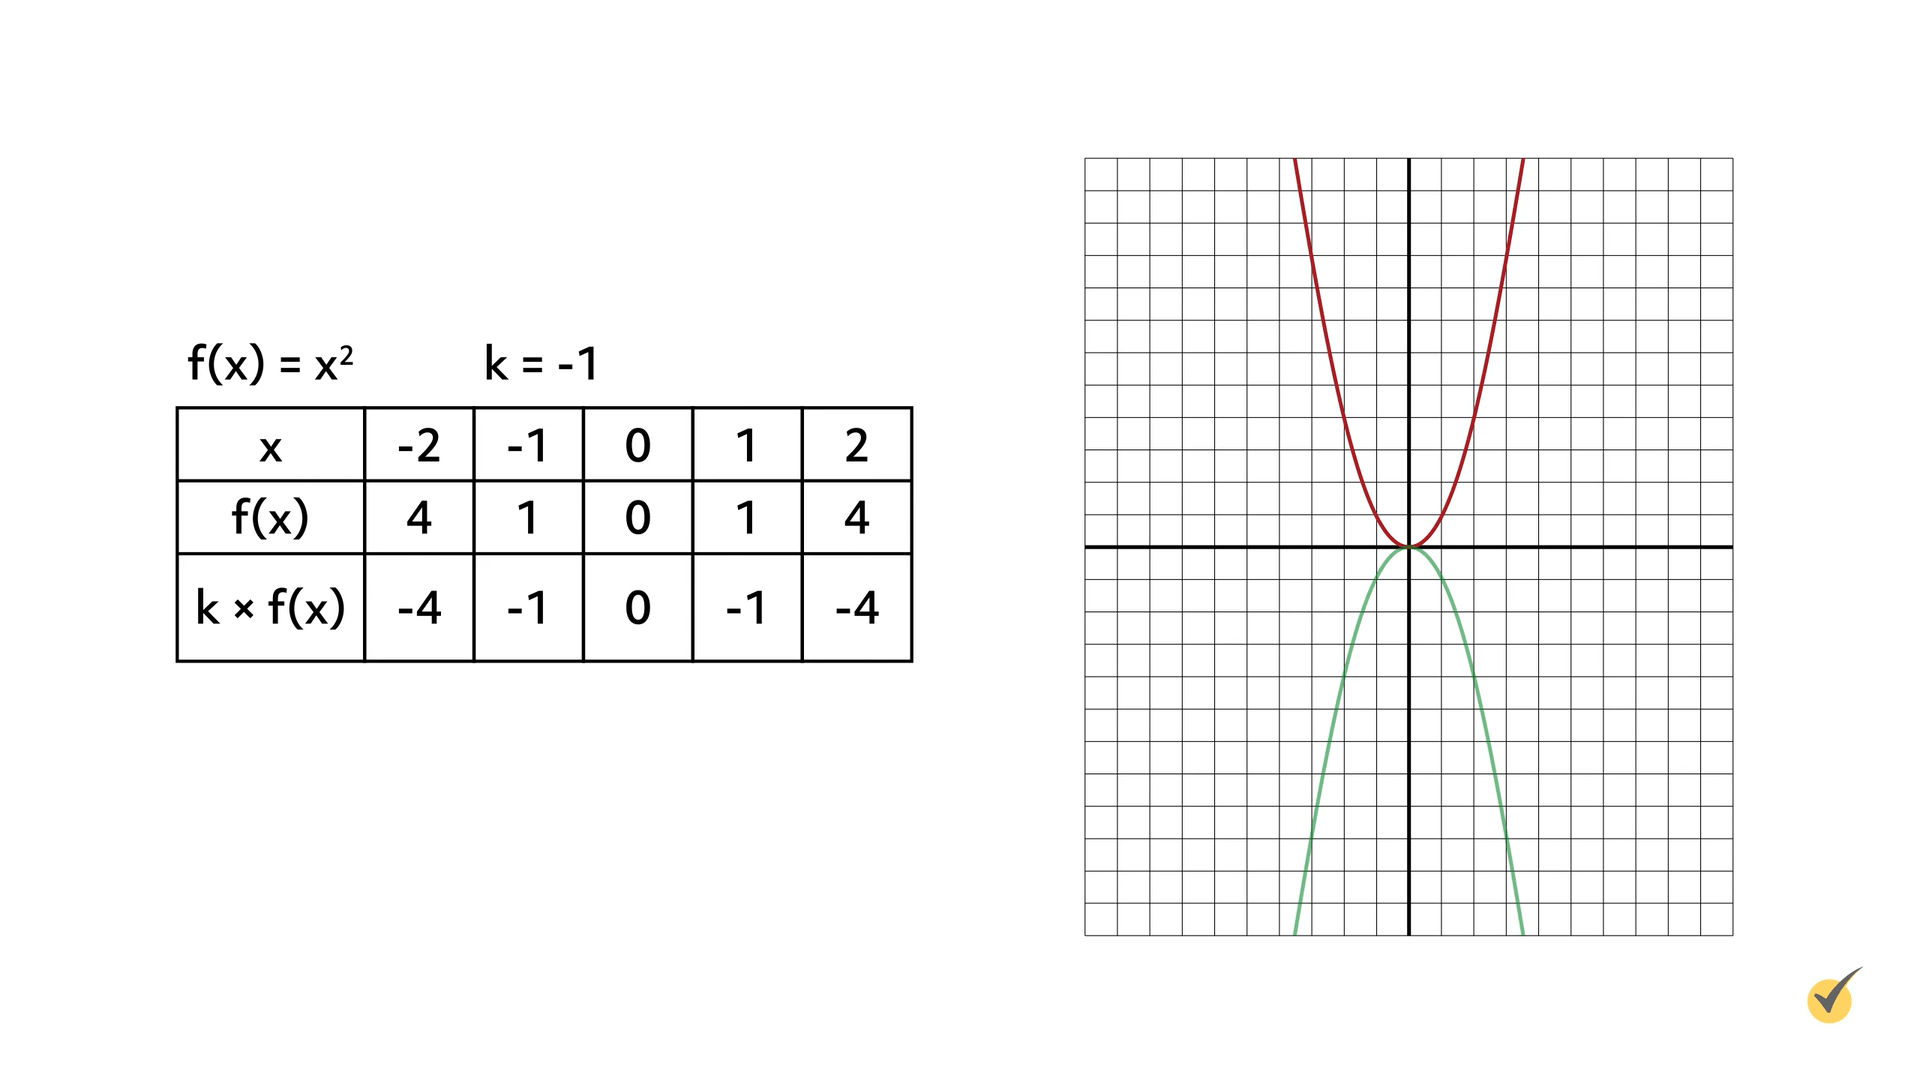
Let’s reflect the function \(f(x)=x^{2}\) across the \(x\)-axis. Using the formula \(k\times f(x)\), multiply the function \(f(x)\) by a number (\(k\)) that is less than zero. In the example shown here, the value of \(k\) is -1:
The original function (shown in red) is reflected across the \(x\)-axis by multiplying the \(y\)-coordinates by -1. The reflection is shown in green. If the coordinate plane were folded along the \(x\)-axis, the two functions would align.
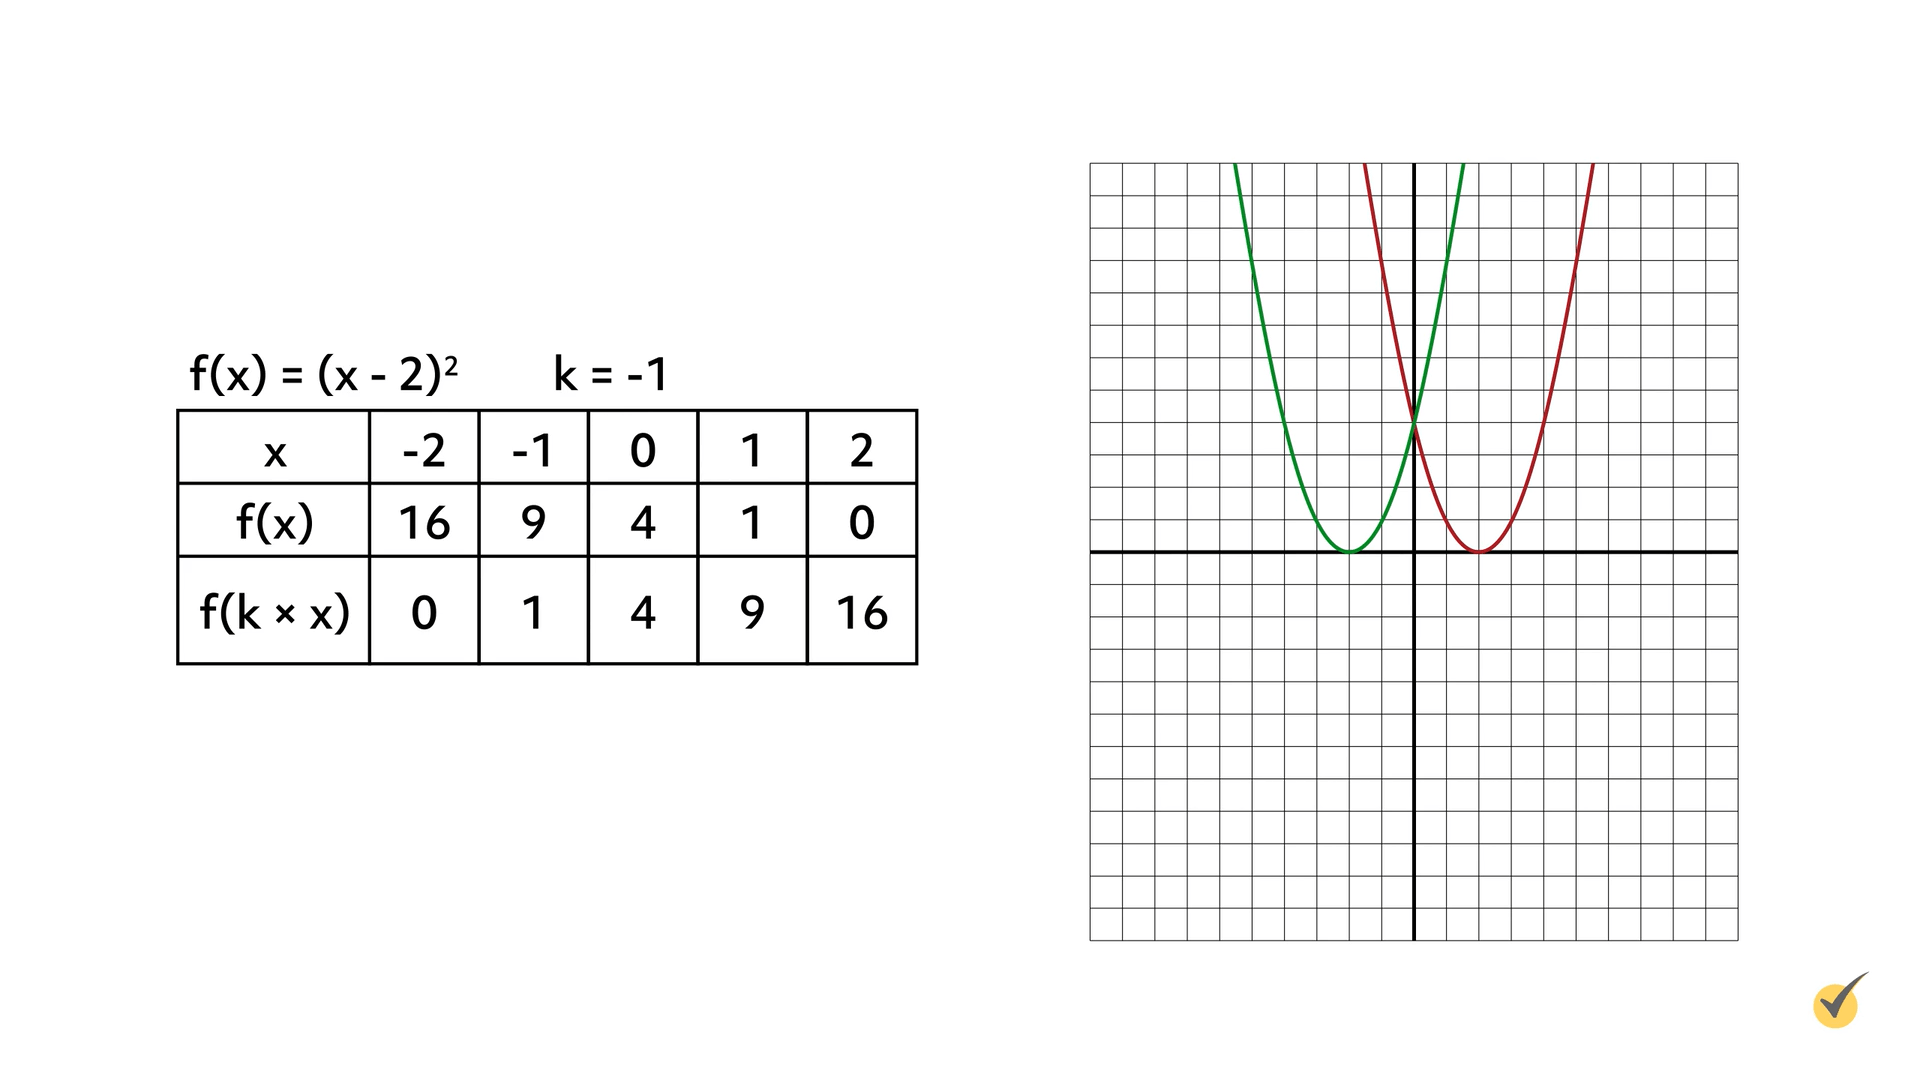
Now let’s reflect the function \(f(x)=(x-2)^{2}\) across the \(y\)-axis. Using the formula \(f(k\times x)\), multiply the \(x\)-value inside parentheses by a number (\(k\)) that is less than zero. In the following example, the value of \(k\) is -1:
The original function in red is reflected across the \(y\)-axis by multiplying the \(x\)-value in parentheses by -1. The reflection is shown in green. If the coordinate plane were folded along the \(y\)-axis, the two functions would align.
Now it’s your turn. I have one last problem for you to analyze. It’s a little more challenging, but I know you can handle it.
Graphs of functions can be reflected across an axis, in addition to being stretched or compressed.
Consider the function \(f(x)=x^{2}\). Reflect this function across the \(x\)-axis and stretch it vertically by a factor of 4. Show your work in a table and on a graph.
Now that you’ve seen the problem, pause the video here and see if you can answer it yourself. When you’re ready, resume the video and we’ll go over the answers together.
Now that you’ve tried this problem yourself, let’s go over it together.
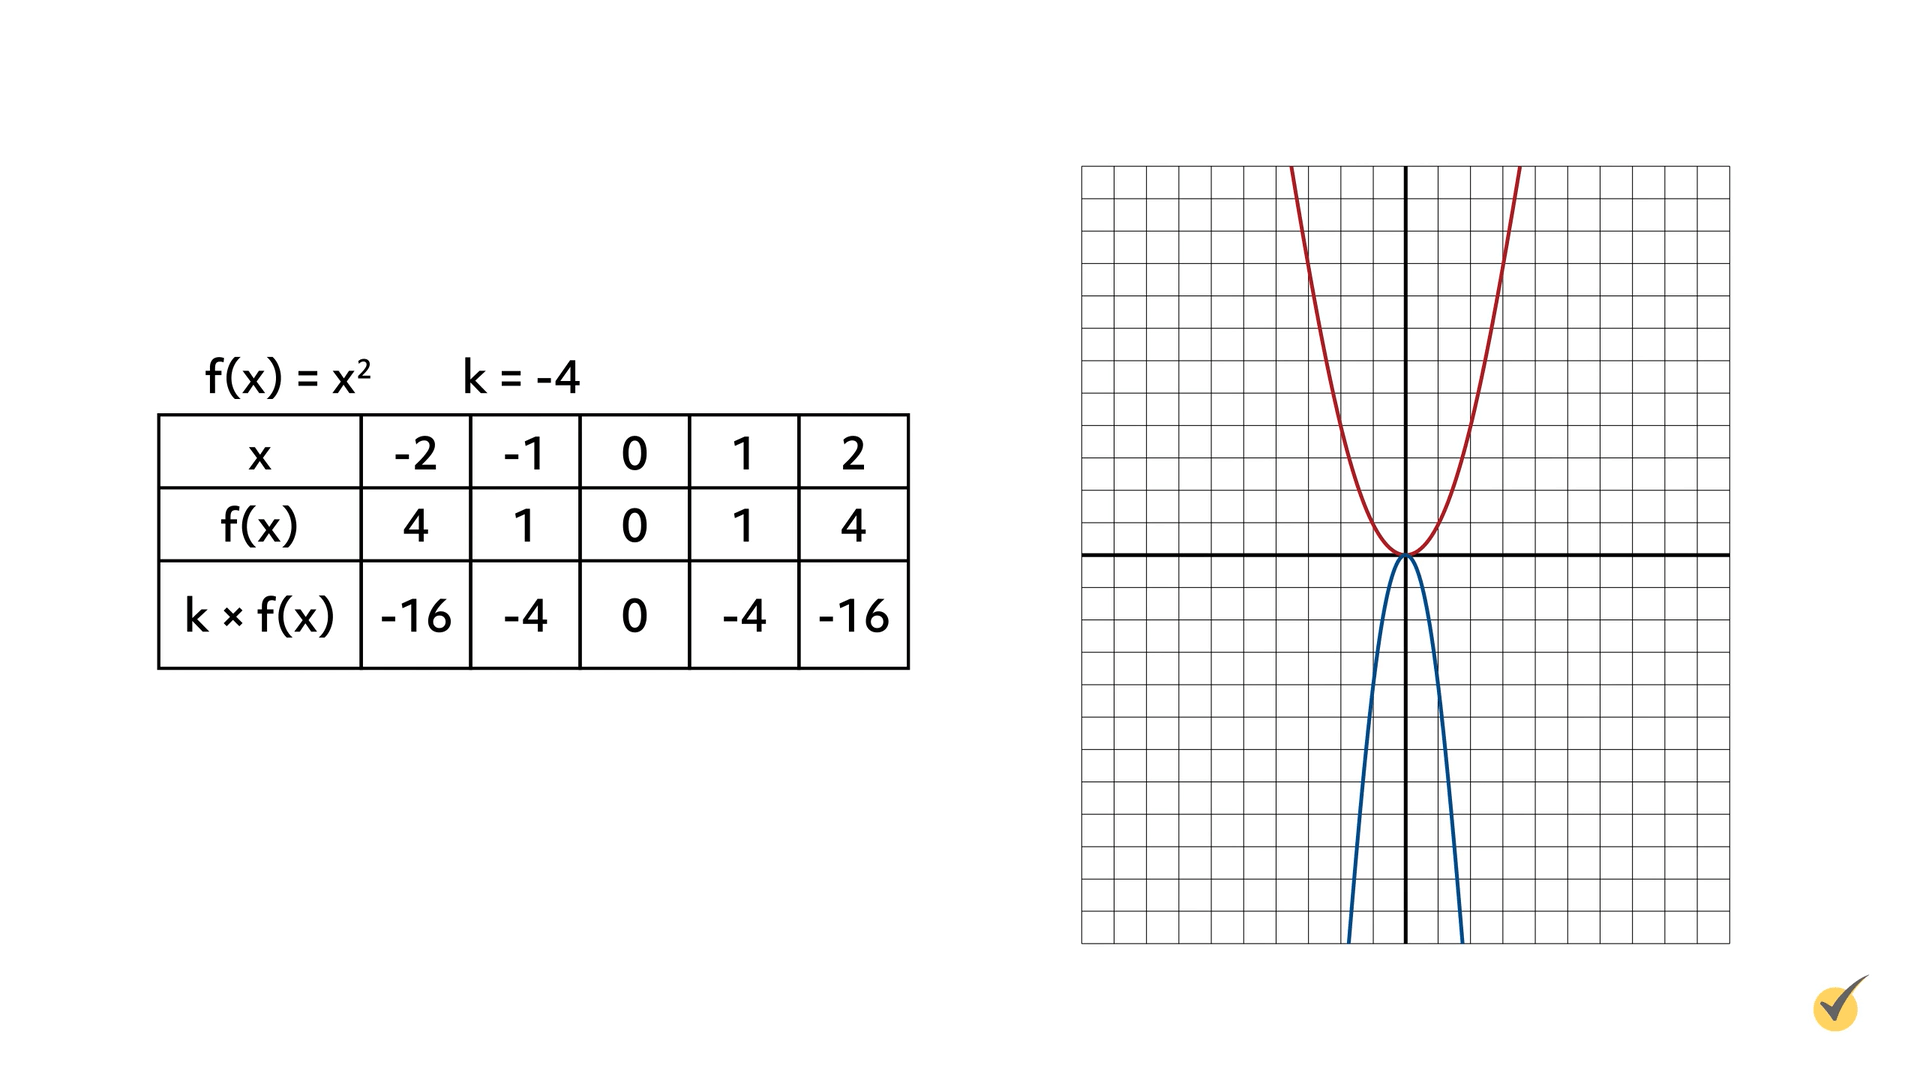
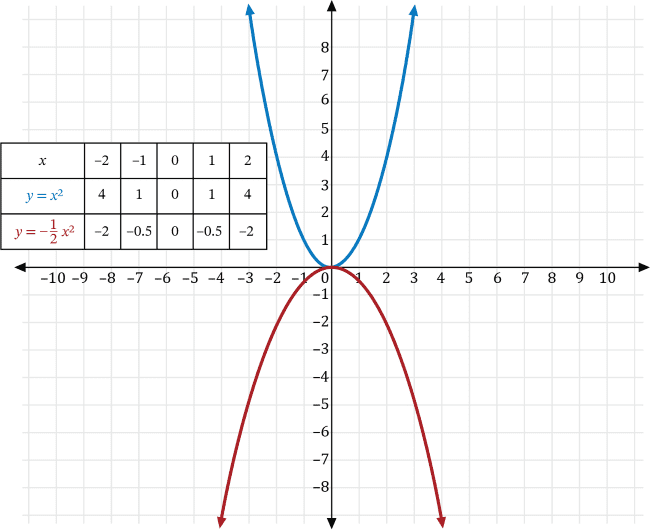
Consider the function \(f(x)=x^{2}\). Reflect this function across the \(x\)-axis and stretch it vertically by a factor of 4. Show your work in a table and a graph.
| \(x\) | -2 | -1 | 0 | 1 | 2 |
| \(f(x)\) | 4 | 1 | 0 | 1 | 4 |
| \(k\times f(x)\) | -16 | -4 | 0 | -4 | -16 |
The original function is shown in red and the new function is shown in blue. The function is stretched vertically and reflected across the \(x\)-axis by multiplying each of the \(y\)-coordinates by -4.
I hope this video about the manipulation of functions was helpful. Thanks for watching, and happy studying!
Function Manipulation Practice Questions
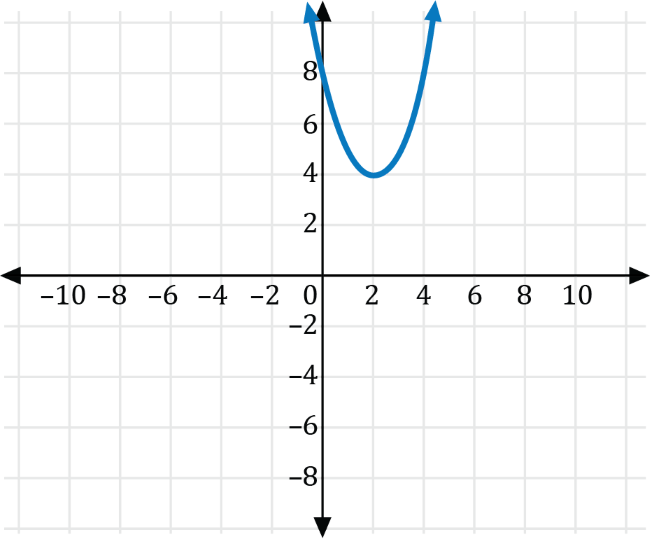
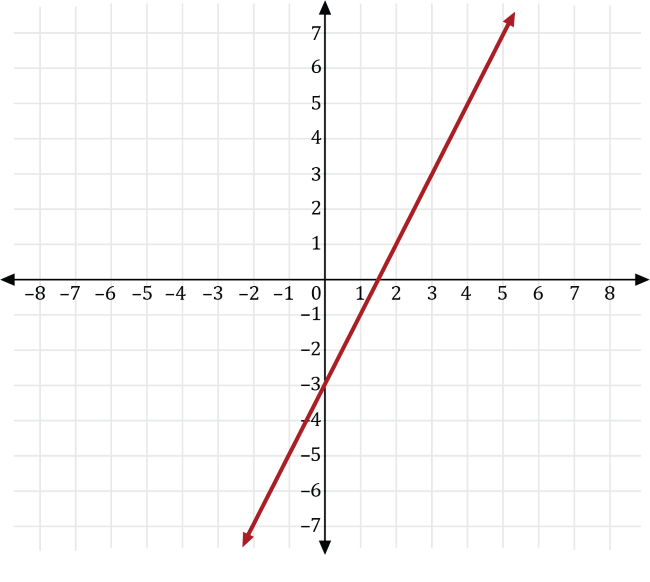
The graph of the function \(y=f(x)\) is shown on the coordinate plane below.
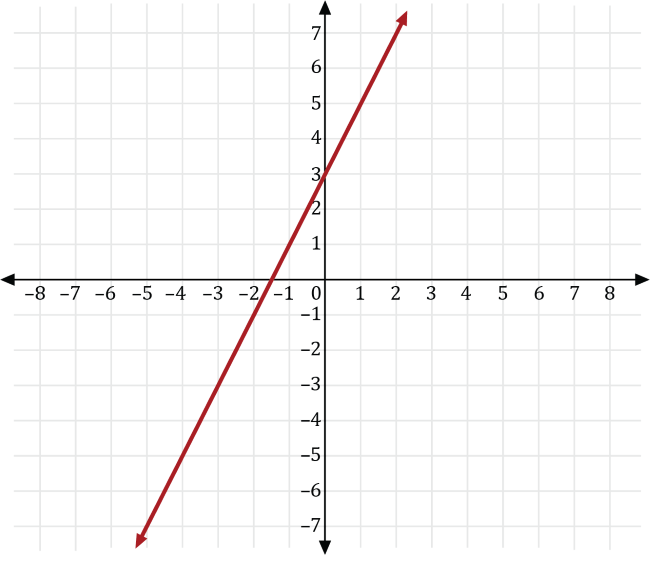
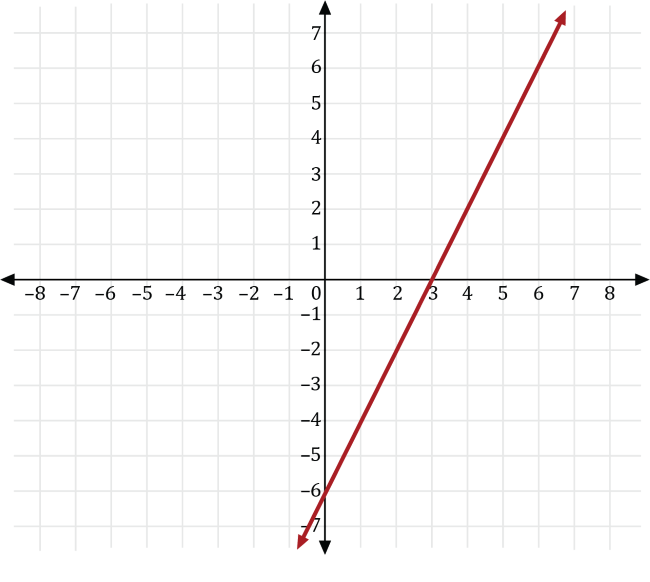
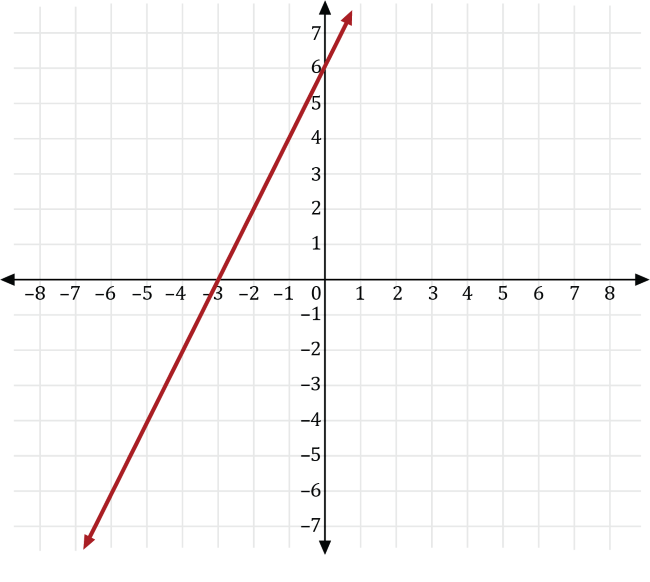
Which of the following is the graph of \(g(x)=f\left(x-4\right)+2\)?
Let \(h\) and \(k\) be real numbers. We can translate the graph of the function \(y=f(x)\) the following ways to produce an equation for the graph of \(g\):
- If \(g(x)=f\left(x-h\right)\), then the graph of \(g\) is a horizontal shift of the graph of \(f\) that is \(h\) units to the left if \(h\lt0\), and h units to the right if \(h>0\).
- If \(g\left(x\right)=f\left(x\right)+k\), then the graph of \(g\) is a vertical shift of the graph of \(f\) that is \(k\) units upwards if \(k>0\), and \(k\) units downwards if \(k\lt0\).
For the graph of \(g(x)=f\left(x-4\right)+2\), \(h=4\) and \(k=2\), which means the graph of \(f\) is shifted horizontally 4 units to the right, then shifted vertically 2 units upwards. The graph of \(f\) and the translated graph of \(g\) are shown in the coordinate plane below.
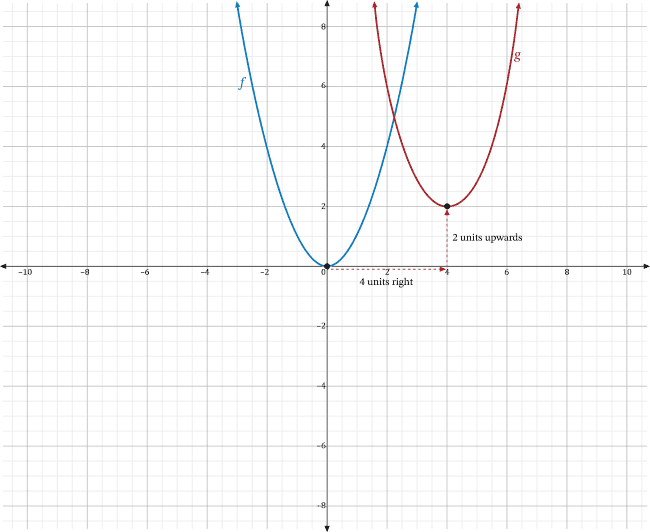
While each point for the graph of \(f\) is translated 4 units to the right then 2 units upwards, the graph only explicitly shows how the vertex for \(f\) is translated to the vertex of \(g\).
Let \(f\left(x\right)=2x+3\). If the graph of \(y=g(x)\) is the result of shifting the graph of \(f\) horizontally 5 units to the left, then vertically 6 units upwards, which of the following will be the equation for the graph of \(g\)?
Let \(a\neq0\), \(h\), and \(k\) be real numbers. We can transform the graph of the function \(y=f(x)\) the following ways to produce an equation for the graph of \(g\):
- If \(g\left(x\right)=af(x)\), then the graph of \(g\) is a vertical stretch of the graph of \(f\) if \(a>0\), and a vertical compression if \(0\lt a \lt1\). Furthermore, if \(a\lt0\), the graph is reflected across the \(x\)-axis.
- If \(g(x)=f\left(x-h\right)\), then the graph of \(g\) is a horizontal shift of the graph of \(f\) that is \(h\) units to the left if \(h\lt0\), and \(h\) units to the right if \(h>0\).
- If \(g\left(x\right)=f\left(x\right)+k\), then the graph of \(g\) is a vertical shift of the graph of \(f\) that is \(k\) units upwards if \(k>0\), and \(k\) units downwards if \(k\lt0\).
Since we are shifting \(f\) horizontally 5 units to the left to write the equation \(g\), the value for \(h\) must be negative 5 since \(h\lt0\) for this type of transformation. So, the expression for \(g\) must contain \(f\left(x-(-5)\right)=f(x+5)\).
Next, since we are shifting the graph of \(f\) vertically 6 units upwards, the value of \(k\) is positive, so \(g\left(x\right)=f(x+5)+6=\left(2\left(x+5\right)+3\right)\mathbf{+6}\).
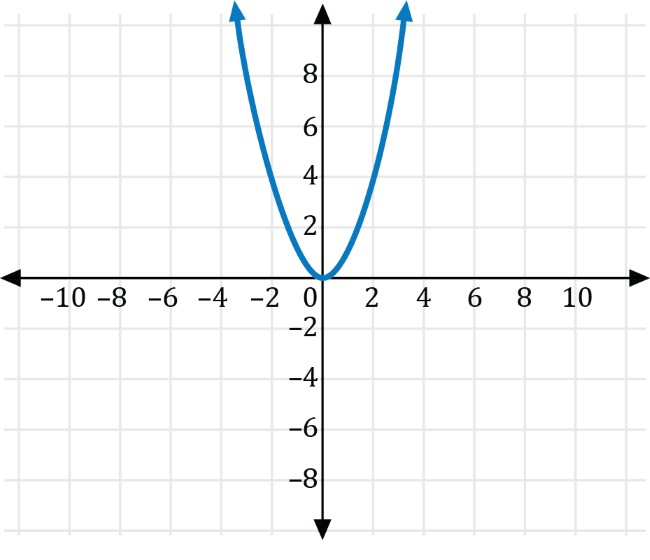
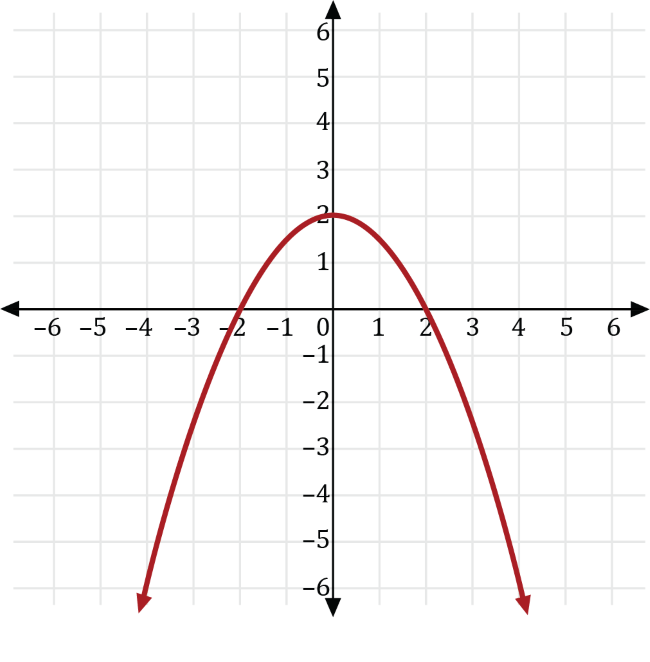
The graph of the function \(f(x)=x^2\) is shown on the coordinate plane below.
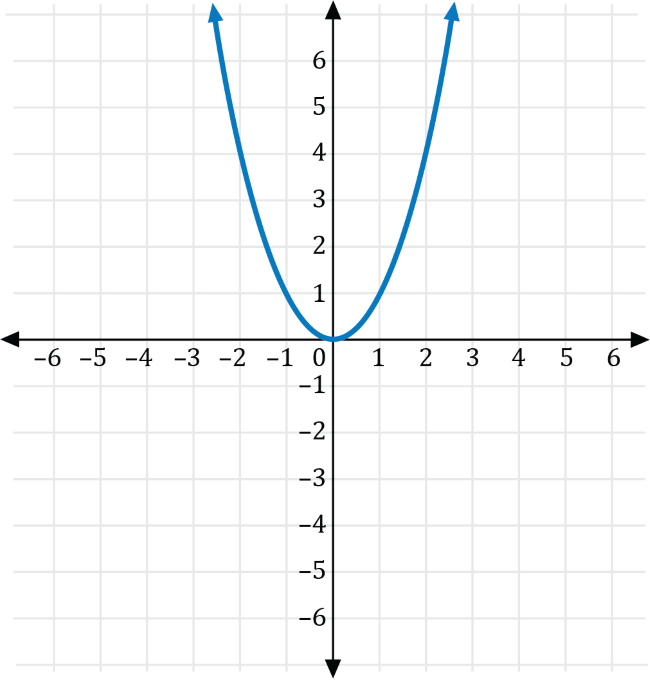
Which of the following is the graph of \(g\left(x\right)=-2f(x)\)?
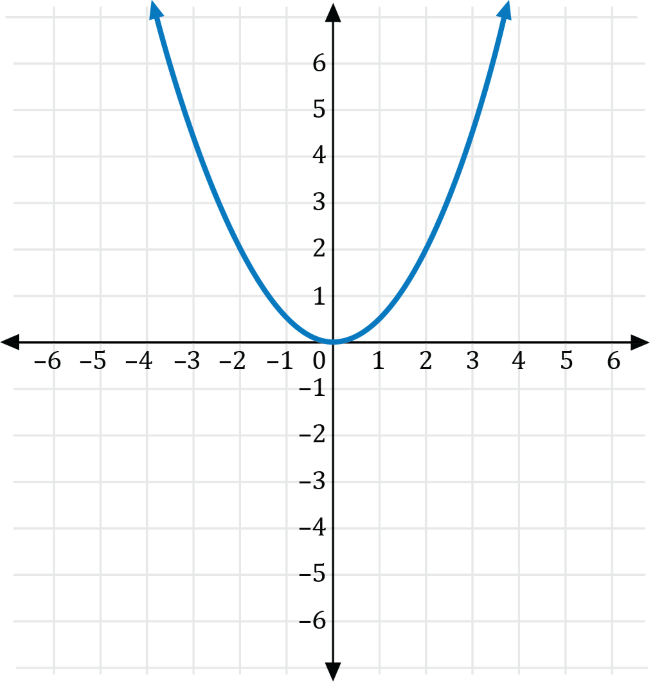
Let \(a\neq0\) be a real number. If \(g(x)=ax^2\), then the graph of \(f(x)=x^2\) is a vertical stretch if \(a>0\), and a vertical compression if \(0\lt a \lt1\). Furthermore, if \(a\lt0\), the graph is reflected across the \(y\)-axis.
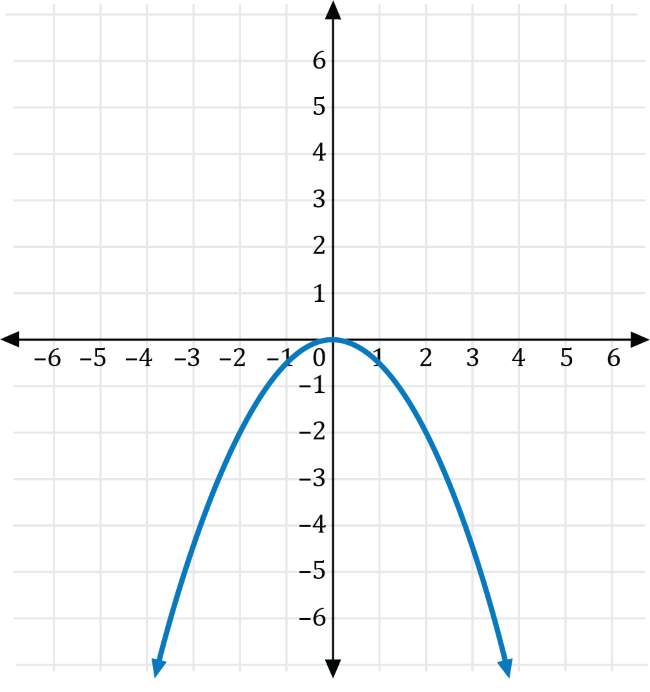
Transforming \(f(x)=x^2\) with \(a=-2\), we get the graph of \(g(x)=-2x^2\), which is a vertical stretch for the graph of \(f(x)=x^2\) that is reflected across the \(x\)-axis shown in red below.
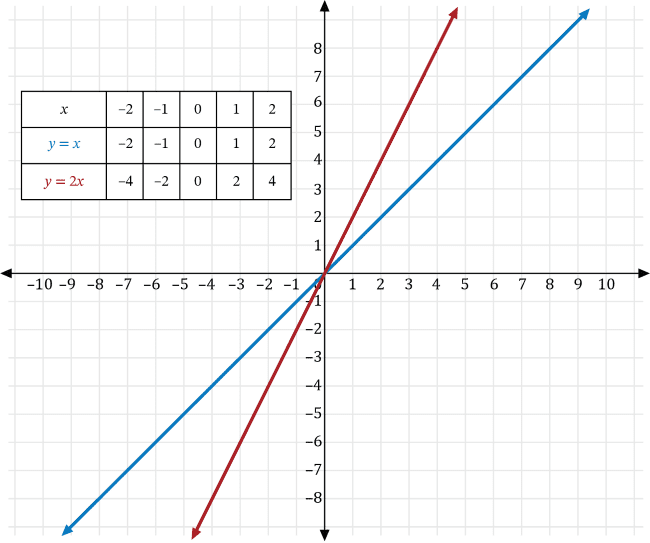
A basketball player plays for a basketball team that plays 20 games for a given season. For the first 10 games of the season, the basketball player scored the same number of points as the number of minutes he played for each game. For the last 10 games, he scored 3 more than twice the number of points he played. If \(x\) is the number of minutes played and \(y\) is the number of points scored, which of the following is a graph of the function that represents the number of points he scored for the last 10 games of the season?
Since the basketball player scores as many points, \(y\), as minutes played, \(x\), for the first 10 games, we can write the number of points he scored as \(y=x\).
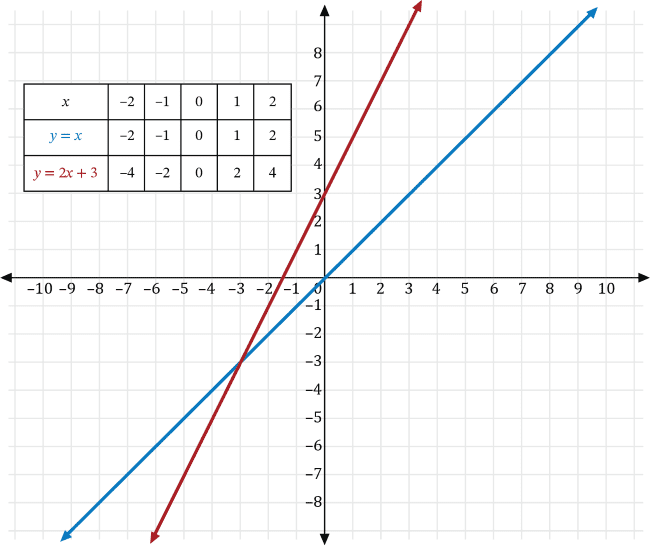
For the last 10 games, the basketball player scored 3 more than twice the number of minutes he played the first ten games, so we can transform the graph of \(y=x\) to the graph of \(y=2x+3\).
Let \(a\neq0\) and \(k\) be real numbers. We can transform the graph of the function \(y=x\) to find the graph of a function that represents the number of points scored for the last 10 games using the following transformations:
- If \(y=kx\), then the graph of \(y=x\) is a vertical stretch if \(a>0\), and a vertical compression if \(0\lt a \lt 1\). Furthermore, if \(a\lt0\), the graph is reflected across the \(x\)-axis.
- If \(y=f(x)+k\), then the graph of the function \(y\) is a vertical shift of the graph of \(f\) that is \(k\) units upwards if \(k>0\), and \(k\) units downwards if \(k\lt0\).
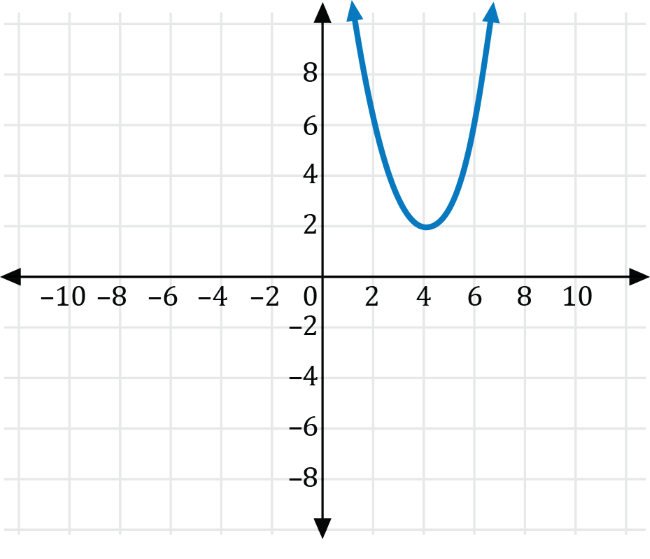
Transforming \(y=x\) with \(a=2\), we get the graph of \(y=2x\), which is a vertical stretch of the graph of \(y=x\) shown in red below.
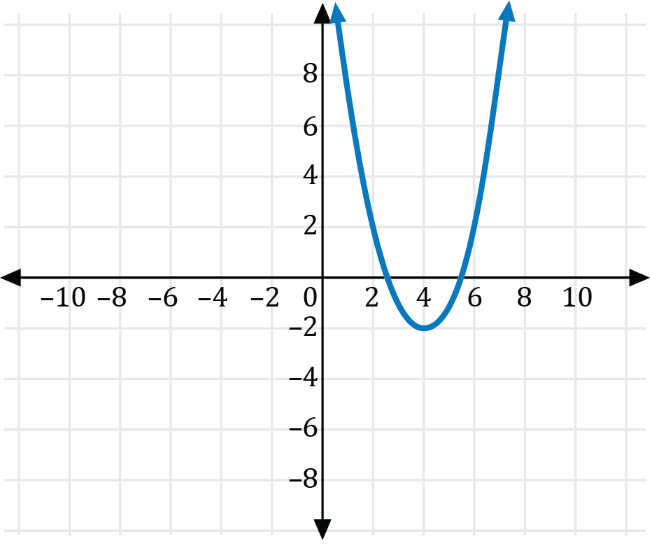
Next, transforming \(y=2x\) with \(k=3\), we get the graph of \(y=2x+3\), which is a vertical shift upwards 3 units of the graph of \(y=2x\) shown in red below.
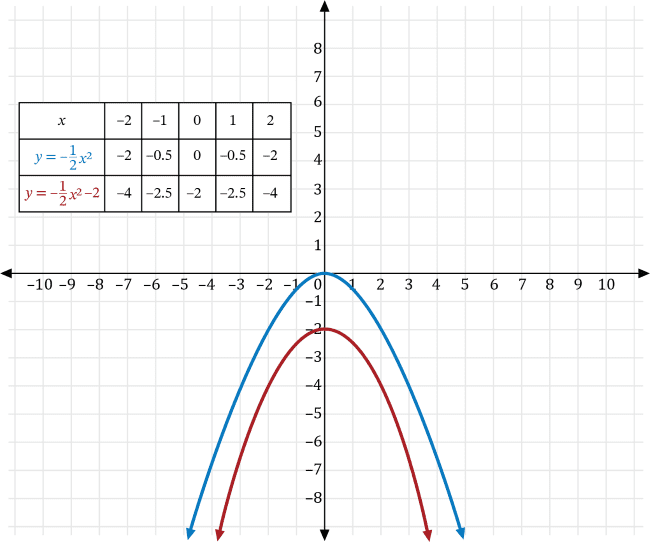
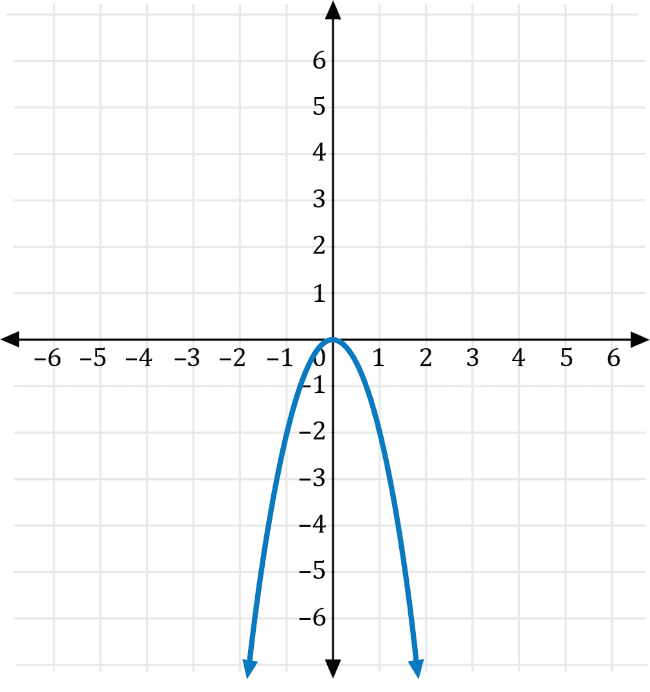
The square of some number is transformed so the result is 2 less than one-half the negative of its square. If \(y\) is the square of some number, \(x\), then which of the following is the graph of the transformed result?
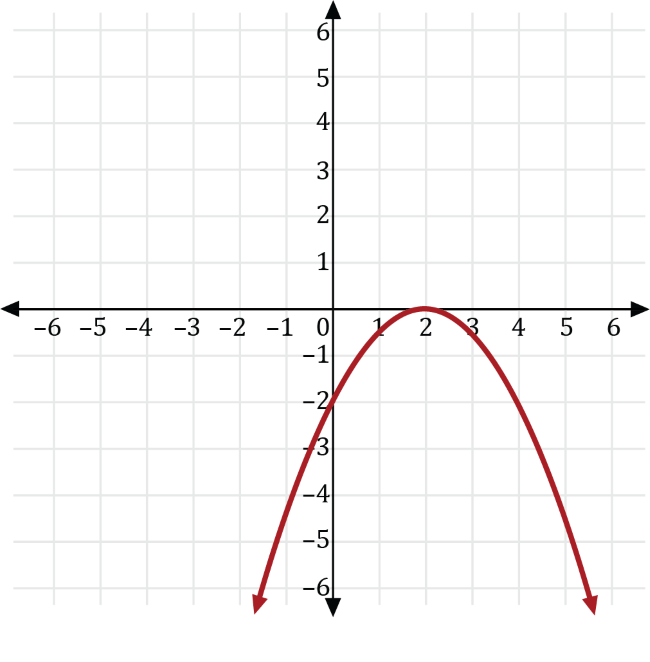
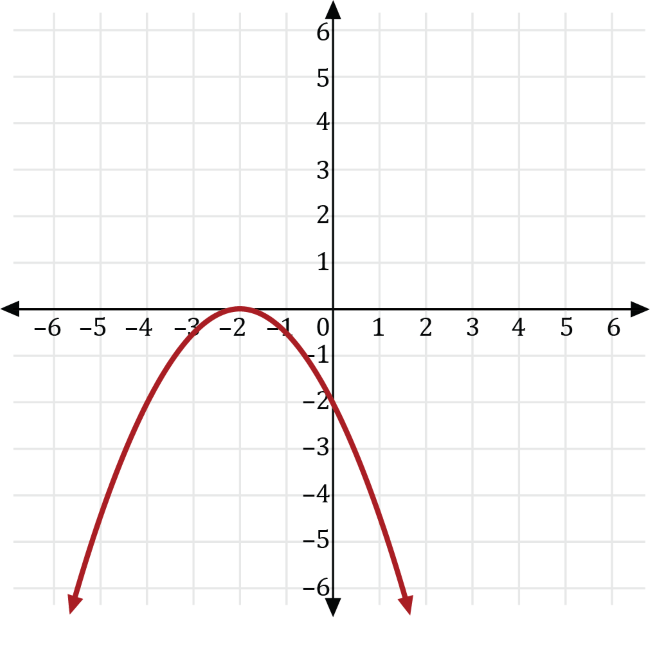
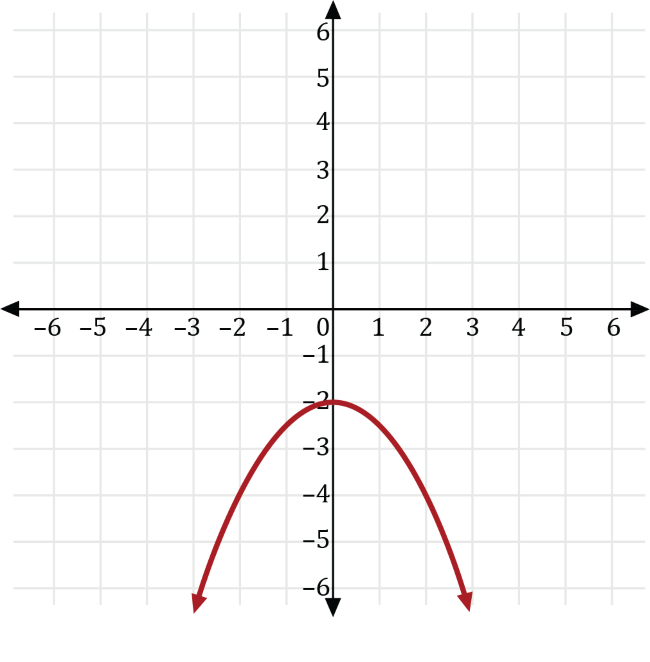
We can write the square of some number, \(x\), as \(y=x^2\). Transforming \(y=x^2\) so the result is 2 less than one-half the negative of its square, gives us the transformed function \(y=-\frac{1}{2}x^2-2\).
Let \(a\neq0\) and \(k\) be real numbers. We can transform the graph of the function \(y=x^2\) to find the graph of the function that is the result of 2 less than one-half the negative of its square using the following transformations:
- If \(y=kx\), then the graph of \(y=x^2\) is a vertical stretch if \(a>0\), and a vertical compression if \(0 \lt a \lt 1\). Furthermore, if \(a \lt 0\), the graph is reflected across the \(x\)-axis.
- If \(y=f(x)+k\), then the graph of the function \(y\) is a vertical shift of the graph of \(f\) that is \(k\) units upwards if \(k>0\), and a \(k\) units downwards if \(k \lt 0\).
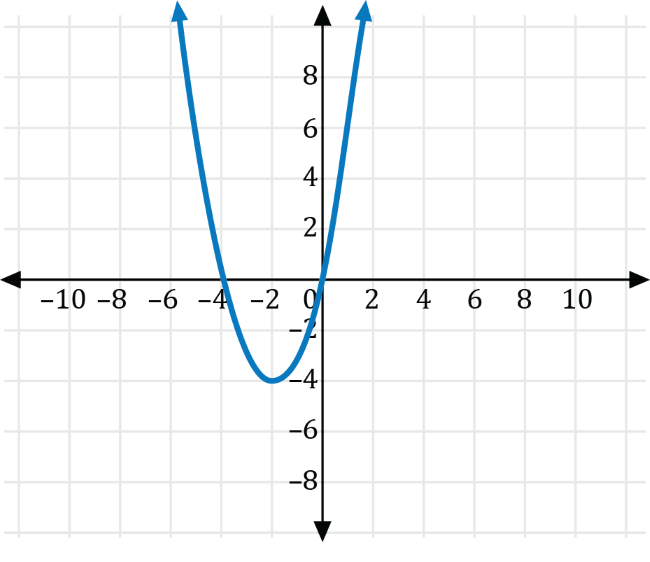
Transforming \(y=x^2\) with \(a=-\frac{1}{2}\), we get the graph of \(y=-\frac{1}{2}x^2\), which is a vertical compression of \(y=x^2\) that is reflected across the \(x\)-axis shown in red below.
Next, transforming the graph of \(y=-\frac{1}{2}x^2\) with \(k=-2\), we get the graph of \(y=-\frac{1}{2}x^2-2\) which is a vertical transformation down 2 units of the graph \(y=-\frac{1}{2}x^2\) shown in red below.