Electronic Absorption and Emission Spectra

Electronic absorption and emission spectra are graphical representations of the wavelengths of electromagnetic radiation that are absorbed or emitted by a particular substance. The incident photon source is a form of electromagnetic radiation such as ultraviolet or visible light. Absorption spectra are produced by measuring the amount of electromagnetic radiation absorbed by a substance at a range of wavelengths from an incident light source. This image is an example of an absorption spectrum. The locations of the absorption lines indicate the specific wavelengths at which the substance absorbs incident photons. The wavelengths of absorption lines are element-specific. Therefore, absorption spectra can be used to determine the chemical composition of materials.

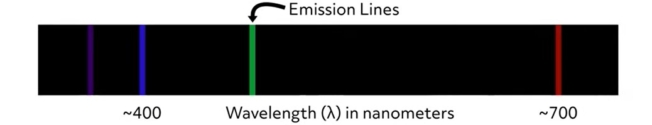
Emission spectra are made by measuring the wavelength and intensity of energy emitted from a specimen when heated or given excess energy in some form. This image is an example of an emission spectrum. The location of the lines indicates the wavelengths of light that are emitted from the sample. As with the absorption spectra, the wavelengths of emission lines are element-specific. Therefore, emission spectra can also be used to determine the chemical composition of materials.
Electromagnetic Radiation: Wavelength and Energy
Electromagnetic radiation is a form of energy generated by coupled electric and magnetic fields oscillating. While electromagnetic radiation is a continuous spectrum of energies, it is often grouped into categories including gamma rays, X-rays, ultraviolet light, visible light, infrared light, microwaves, and radio waves. Electromagnetic radiation can be modeled as either propagating waves or as particle-like bundles of energy called photons.
Electromagnetic radiation travels at the speed of light, and that speed also relates the wavelength and frequency of that radiation. The product of wavelength, \(𝛌\), and frequency, \(f\), for electromagnetic radiation is equal to the speed of light, \(c\).
The wavelength is the distance of one full cycle of the electric and magnetic oscillations and can be measured as the distance from the peak of one wave to the peak of the next wave. The frequency is the rate at which those waves pass a given point.
Importantly, a German scientist named Max Planck determined a connection to the energy of electromagnetic radiation to its frequency (and by extension, its wavelength).
In this equation, \(E\) stands for the photon energy in Joules, \(h\) is a fundamental constant known as Planck’s constant, and \(f\) is the frequency. Using the relationship to the speed of light, this can also be expressed like this:
In this equation, we see that the wavelength is inversely proportional to the energy. Therefore, short wavelength photons such as gamma rays and X-rays have more energy than long wavelength photons such as infrared light and radio waves. This relationship between the energy and wavelength plays an important role in the processes that underly electronic absorption and emission spectroscopy.
Absorption Spectroscopy
Absorption spectroscopy is a common analytical method that allows scientists to identify and study the properties of molecules in a chemical sample. The method is based on the physics of electronic absorption. Absorption occurs when incident photons interact with outermost electrons (such as valence electrons) within a chemical specimen. This interaction involves an electron being excited by the incident photon, causing it to jump from its relatively low energy level or ground state up to a higher energy state. We can visualize the ground state of an electron as a low orbit around an atomic nucleus and the higher energy state as a higher-level orbit. This idea is shown schematically by this simple diagram where the electron is symbolized by the letter e and its ground state is labeled “low energy level.” As the photon approaches the sample, the electron absorbs its energy and is thus excited up to the higher energy level. The reality of the situation is more complicated, but this simple visualization demonstrates the fundamentals of the process.
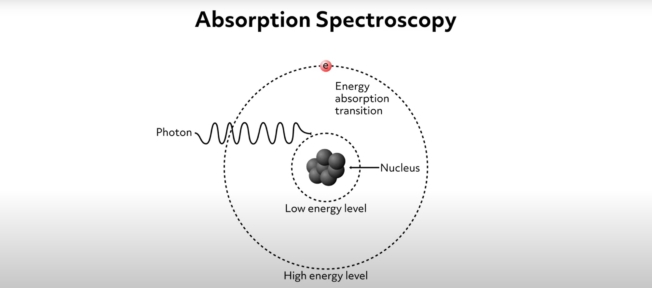
In the process of exciting the electron, the incident photon is absorbed. This process essentially consumes the incident photons of a particular wavelength. Absorption only occurs for specific photon wavelengths because the energy required to excite electrons from their ground state to high energy levels is quantized. This means that the incident photon energy must precisely match the amount needed to excite the electron. If the incident radiation wavelength is slightly greater than the quanta needed to excite the electron, the photons will pass through the sample with no absorption. That is to say, to excite the electron, the energy of the incident photon must be precisely equal to the difference in energy between the electron’s ground state and the higher energy level.
In this way, the specific wavelength of light absorbed by a specimen is element-specific. So, the gaps in the resulting spectrum correspond to the exact energy levels of the electrons of a given element. Absorption can therefore tell us what elements are present and, based on absorption intensity, indicate the element’s concentration in the sample. Other characteristics of the absorption spectra yield information about what types of molecules are present in the sample.
Emission Spectroscopy
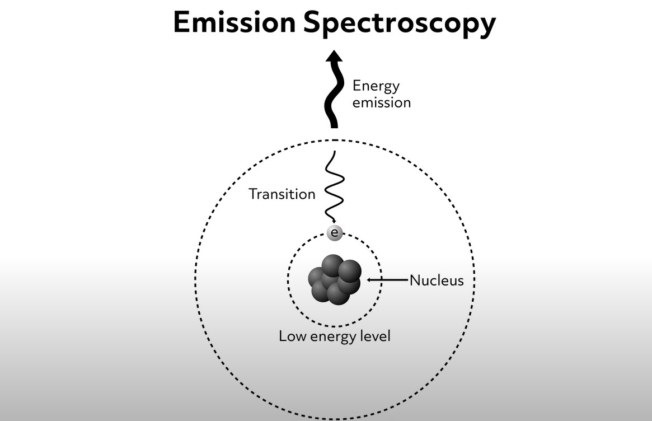
Electron emission spectroscopy allows scientists to study the chemistry of materials using the radiation emitted from a sample that has been excited in some way. The method is based on the observation that an electron that has been excited to its higher energy level eventually falls back to its ground state. Electromagnetic radiation is produced and emitted as the electron returns to its lower energy state. The energy of the radiation emitted during this process is equal to the energy difference between the electron’s ground state and the higher energy level. This process of electronic emission is shown schematically in this diagram.
As mentioned previously, the energy difference between electron ground states and higher energy levels are atom- and molecule-specific. Therefore, the wavelength of light emitted from a specimen can tell us what atoms and molecules are present. This corresponds to the bright lines seen on the emission spectra.
Okay, before we go, let’s go over a couple of review questions.
1. What is an electronic absorption spectrum and how is one generated?
An electronic absorption spectrum is a plot of energy absorbance vs. the wavelength of incident electromagnetic radiation. To generate an absorbance spectrum, a scientist shines a source of electromagnetic radiation through a chemical specimen. The radiation’s wavelength is systematically varied, and the absorbance of certain wavelengths are measured. The incident radiation is absorbed when outer electrons in the specimen are excited from their ground state to higher energy levels. The absorption only occurs at a specific wavelength of incident radiation and is dependent on the types of atoms and molecules present in the sample.
2. What is an electronic emission spectrum and how is one generated?
An electronic emission spectrum is a plot of energy emission vs. the wavelengths of electromagnetic radiation emitted from a specimen. Emission spectra are generated by shining a source of electromagnetic radiation at a chemical specimen while systematically varying the wavelength of the incident radiation. Specific wavelengths of the incident radiation excite electrons in the specimen from their ground states into higher energy levels. As these electrons fall back from this excited state to their ground states, they emit electromagnetic radiation that is recorded. The wavelengths of the energy emitted from a material are diagnostic of its atomic and molecular composition.
That’s all for this review. Thanks for watching, and happy studying!