

Creating new ideas can be a frustrating task. Furthermore, remembering concepts, ideas, and information can be difficult. Graphic organizers provide a means by which to construct a visual map of concepts, ideas, and information. In this video, we will discuss what, exactly, makes graphic organizers so useful and introduce some commonly used types of graphic organizers.
Graphic Organizer Examples
Studies have shown that graphic organizers assist with the retention of information, reading comprehension, student achievement, and critical thinking skills. Though a graphic organizer may initially seem like a waste of time, its benefits in the long run cannot be overstated. Let’s look at a few of the different kinds:
Venn Diagram
Venn diagrams consist of two or more overlapping circles.
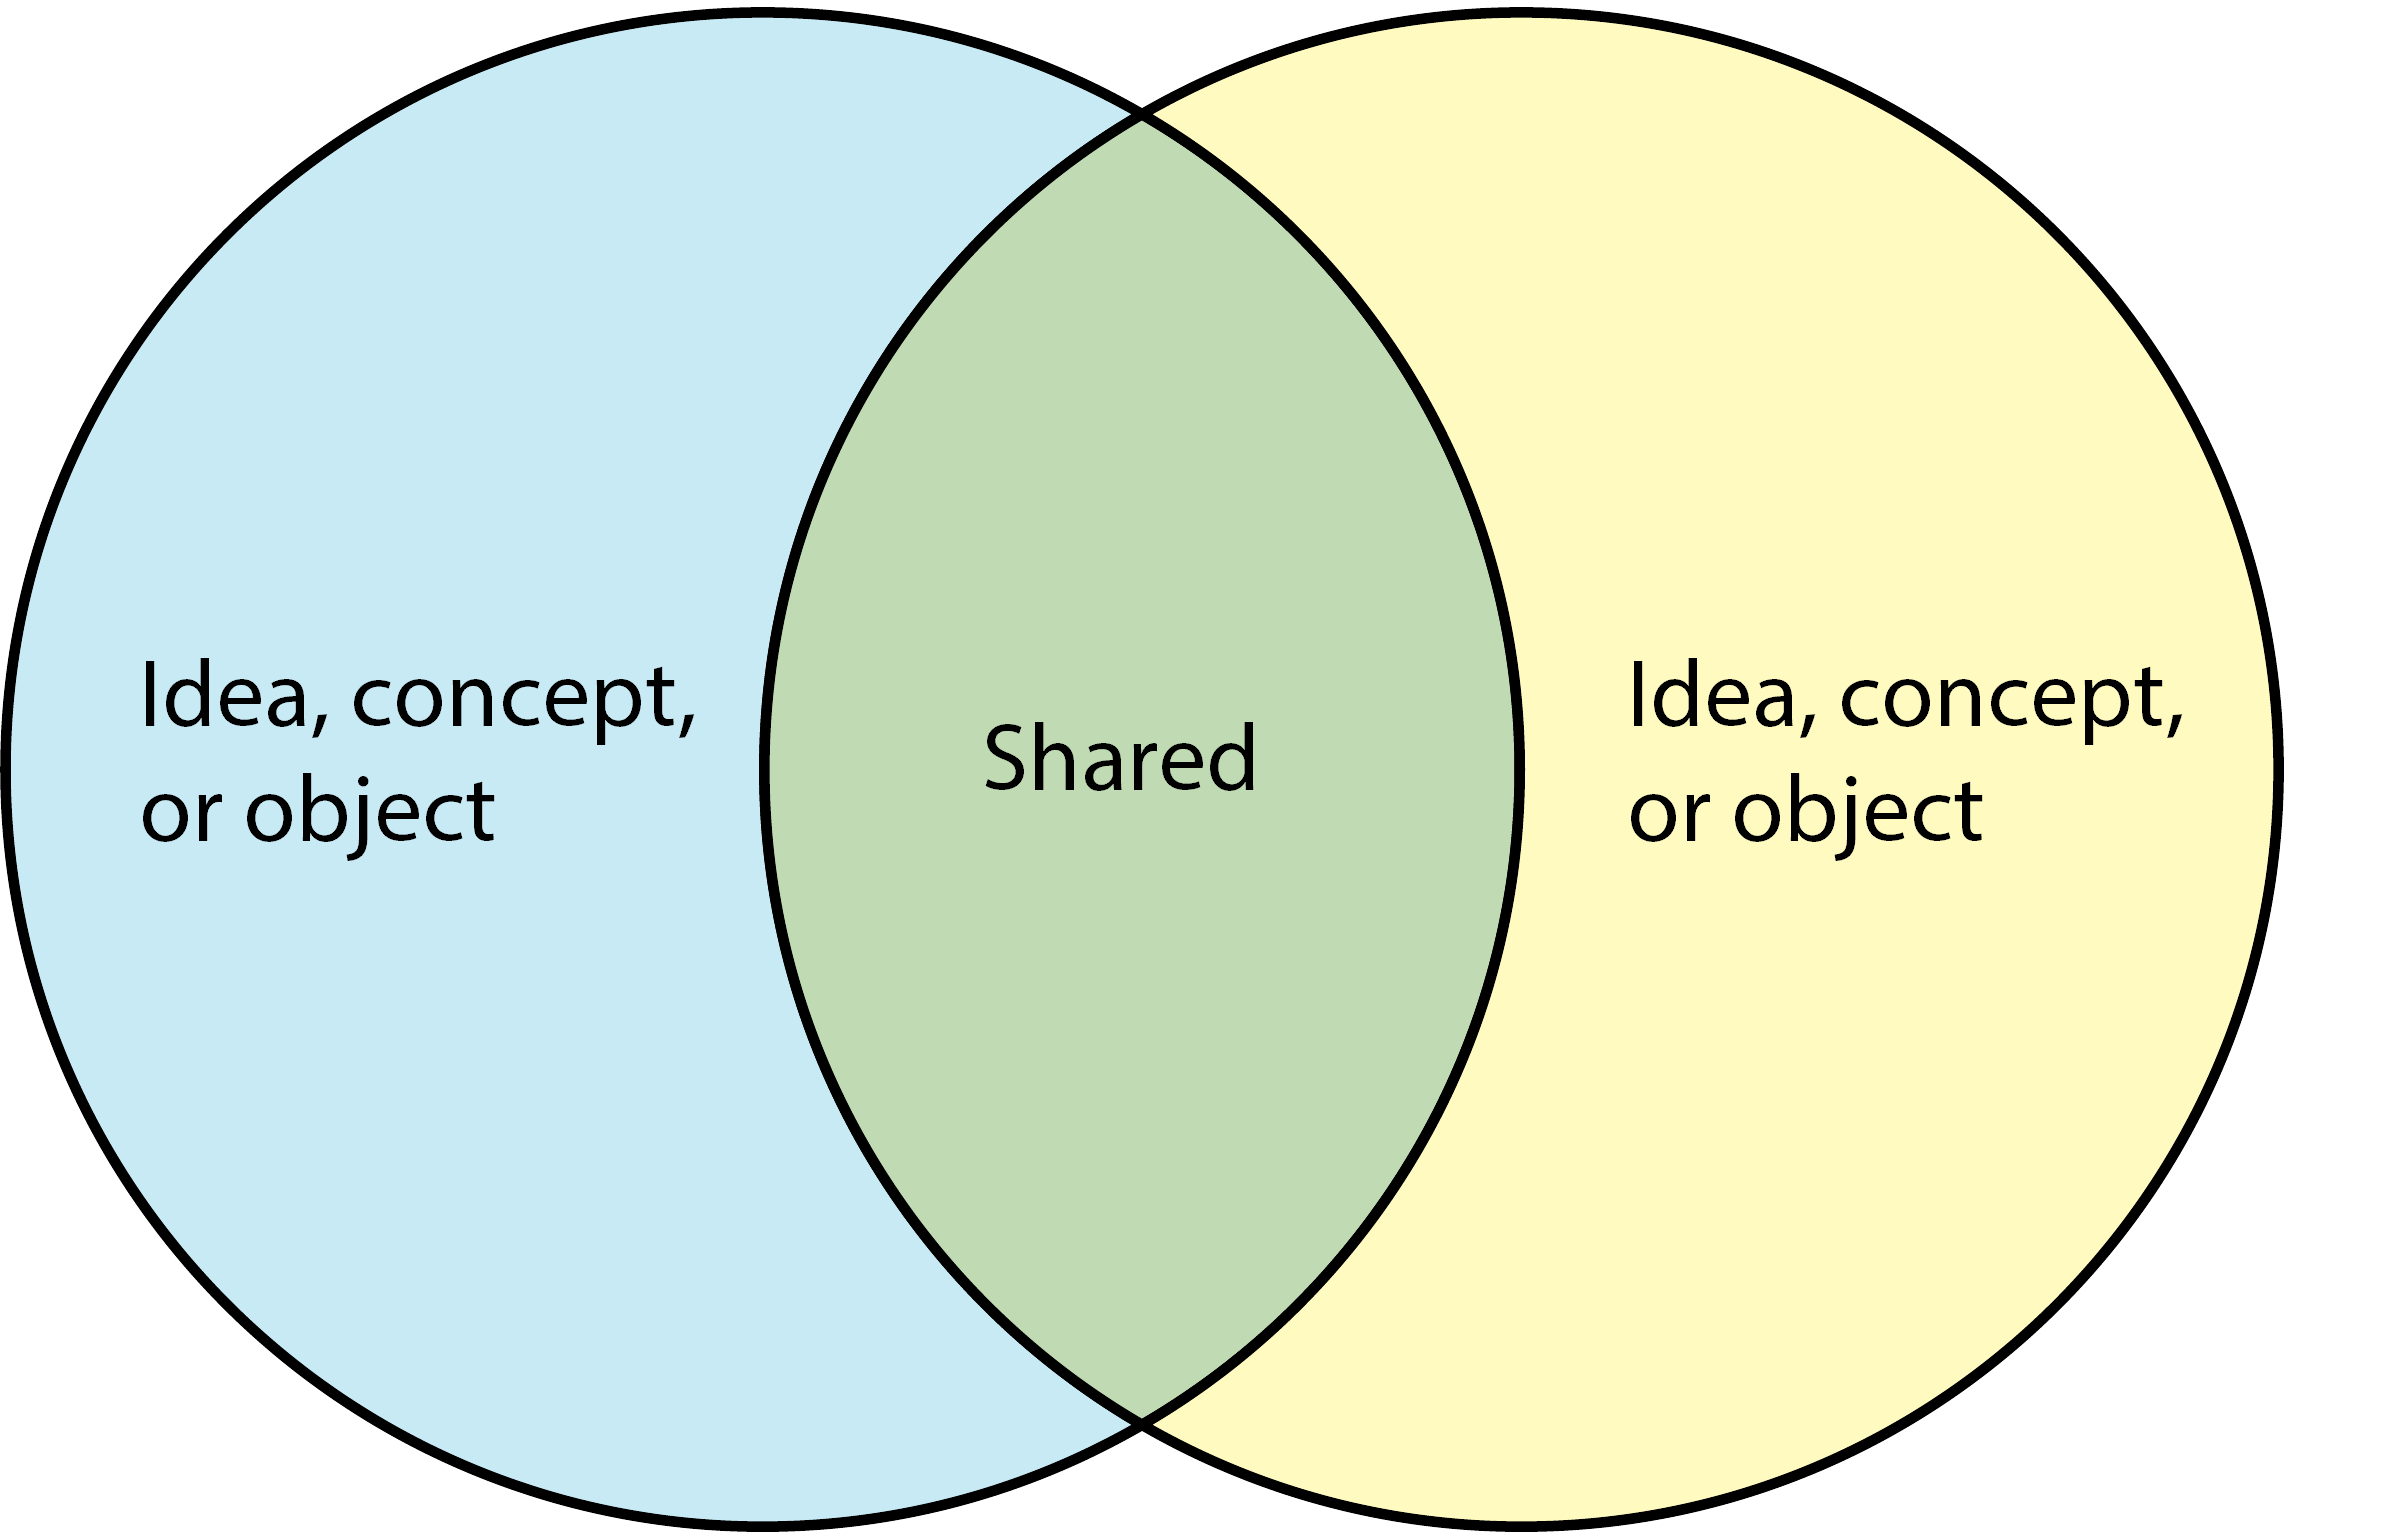
Placed above each circle is an idea, concept, or object. Qualities unique to each idea, concept, or object are listed in their corresponding circles. However, qualities shared between the two are listed in the middle overlapping portion.
Let’s look at a simple example: apples and oranges.
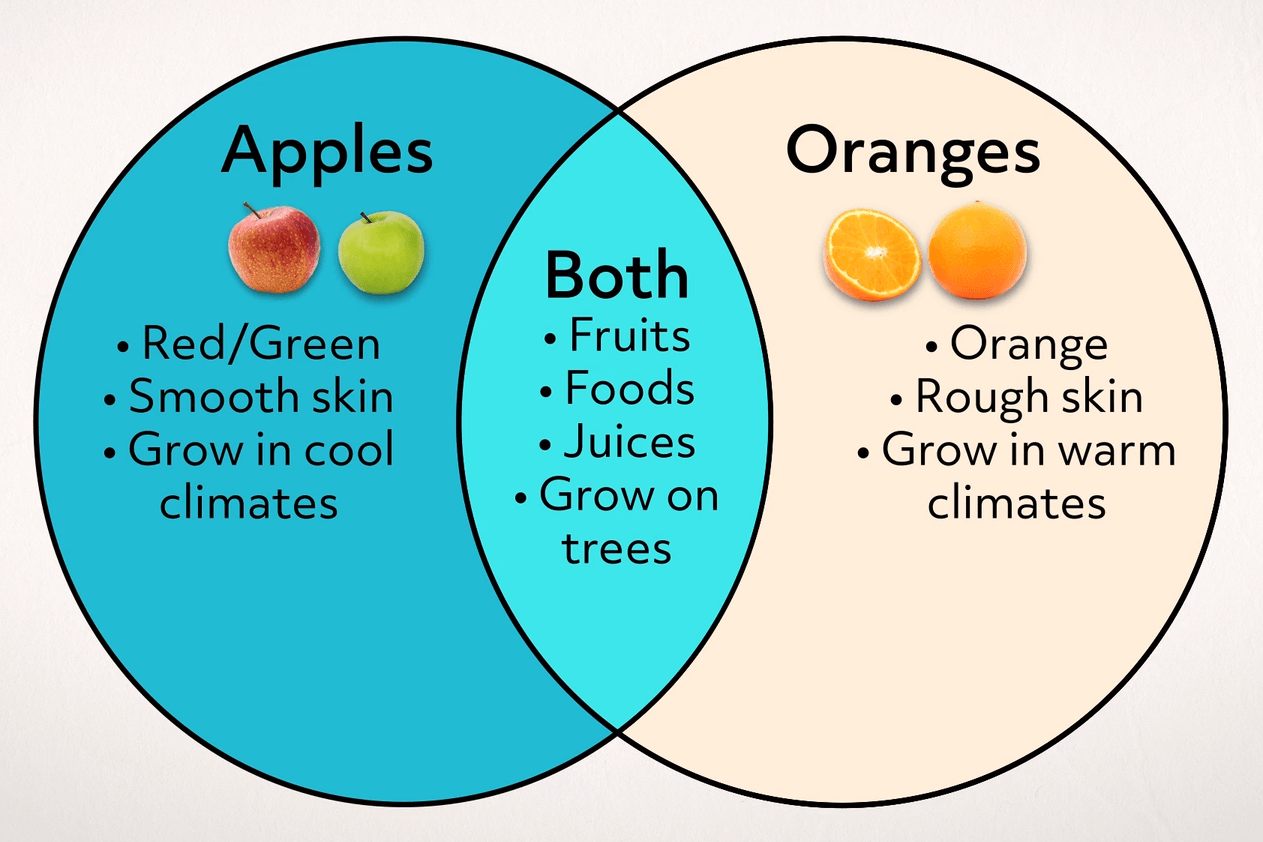
Apples have several different qualities that distinguish them from oranges: they’re (often) red, have smooth skin, and grow in cooler climates. Oranges, on the other hand, are orange in color, have a rough texture, and grow in warmer climates. Yet there are also several similarities: both are fruits, used to make juice, and grow on trees.
This example is of course very simplistic. Some Venn diagrams contain three or four circles, having several areas of overlap between topics.
Venn diagrams are particularly useful when writing a compare/contrast essay. Maybe apples and oranges isn’t a suitable topic for a high school or college essay, but a Venn diagram would be a very useful visual aid for comparing and contrasting ideas like different economic systems (capitalism vs. communism), differences in philosophical ideas, or even different tech products (iPhone vs. Android). In the end, Venn diagrams are a helpful first step and visual aid when writing comparatively.
Spider Diagram (Mind Map)
Another common graphic organizer is a spider diagram, also known as a mind map.
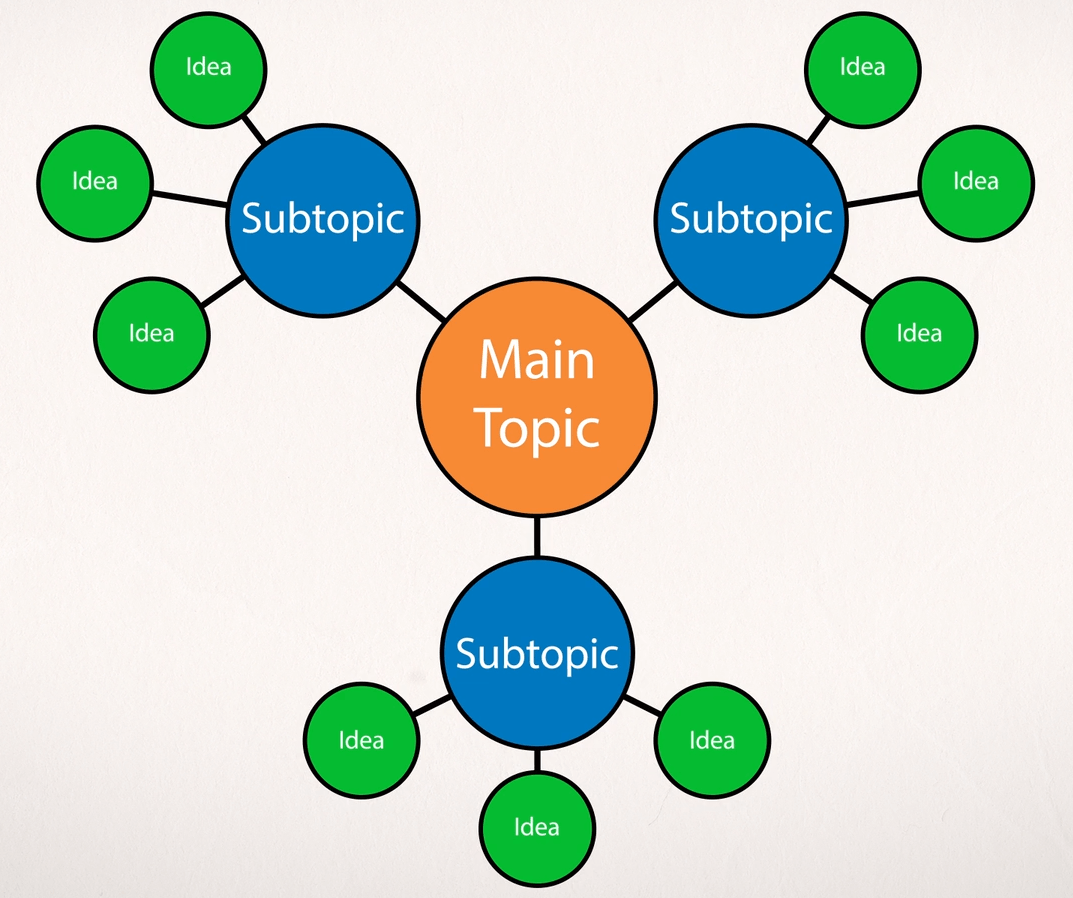
A spider diagram, or a spider map, takes your main idea or topic and places it in a central bubble. All of the supporting points branch off of this main idea, and even smaller details can branch off of the supporting points. This is a great way to visualize and organize ideas and see how they are all connected.
Outline
Outlines are another useful graphic organizer.
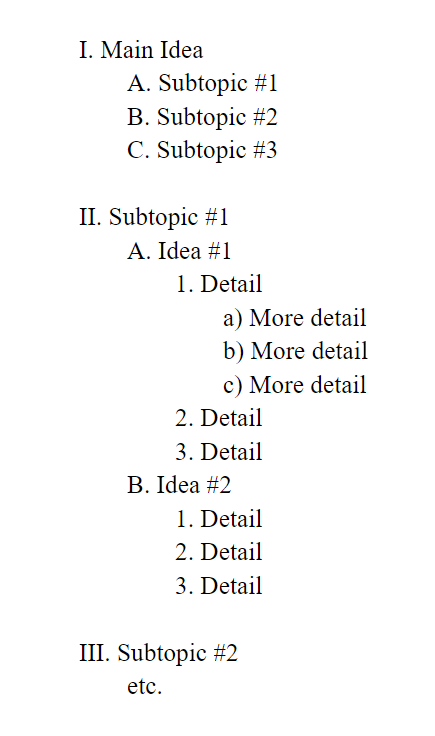
Whether you are reading a text and want to diagram the main and supporting ideas, or you’re writing your own essay and want to organize your thoughts and ideas beforehand, an outline will help you break everything down into parts using Roman numerals, letters, and numbers.
Outlines flow from general to specific ideas. For instance, main ideas as denoted by Roman numerals are relatively broad, while content following lowercase letters can be quite specific.
Review
Which kind of graphic organizer is particularly beneficial when comparing similarities and differences between topics?
- Venn diagram
- Flow chart
- Outline
- None of the above
Thanks for watching, and happy studying!