Graphing Linear Functions
This video shows examples of changing constants in graphs of functions using linear equations.

Hello, and welcome to this video about graphs of linear functions!
Today we’ll explore what happens to a graph when the slope or \(y\)-intercept is changed. Specifically, we’ll examine what happens when these constants are positive or negative values, as well as when the slope is a fractional value.
Before we get started, let’s review a few things. A linear function is a function that is a straight line when graphed. Its equation can be written in slope-intercept form, \(y = mx + b\). The variable \(m\) represents the slope, which measures the direction and steepness of the line graphed. The slope is found by calculating the rise over run, which is the change in \(y\)-coordinates divided by the change in \(x\)-coordinates. The variable \(b\) represents the \(\mathbf{y}\)-intercept, the point where the graph of a line intersects the \(y\)-axis.
Let’s take a look at an example together. Consider the equation \(y = 2x + 1\):
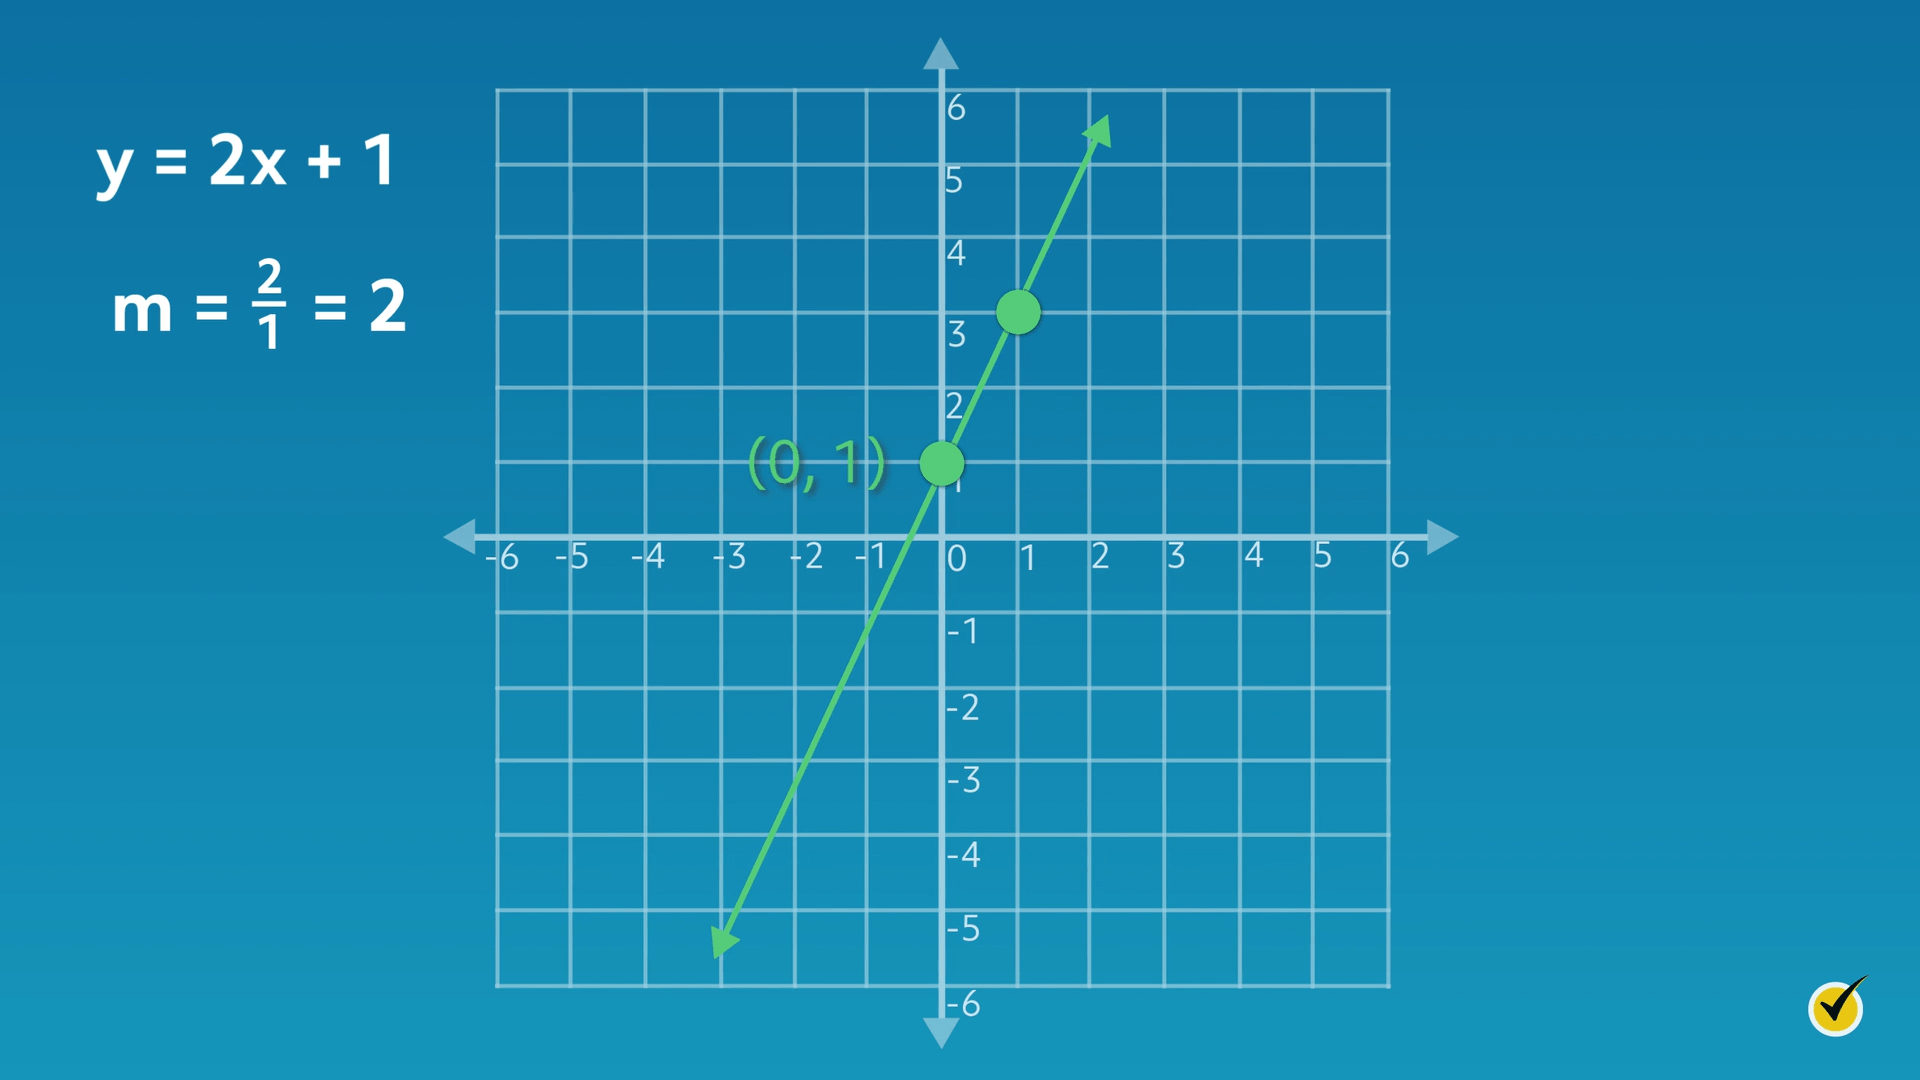
Let’s start by finding the \(y\)-intercept. Looking at the graph, we see that the line crosses through the \(y\)-axis at \(1\), or \((0, 1)\). Our equation reflects this because the value of \(b\) is \(1\).
Now let’s examine the slope. From the \(y\)-intercept, the second point is found by moving in a vertical direction, the rise, and then a horizontal direction, the run. From the \(y\)-intercept, move two units up and one unit to the right.
Therefore, our slope (\(m\)) equals \(\frac{2}{1}\), which equals \(2\). Our equation reflects this because the value for \(m\) is \(2\).
Now let’s consider how the graph changes if we change the slope. Consider the equation \(y = -2x + 1\). It is the same as our last equation, except now our value for the slope is a negative number, \(-\frac{2}{1}\), or \(-2\). Let’s examine the new graph for this equation and compare it to the previous graph:
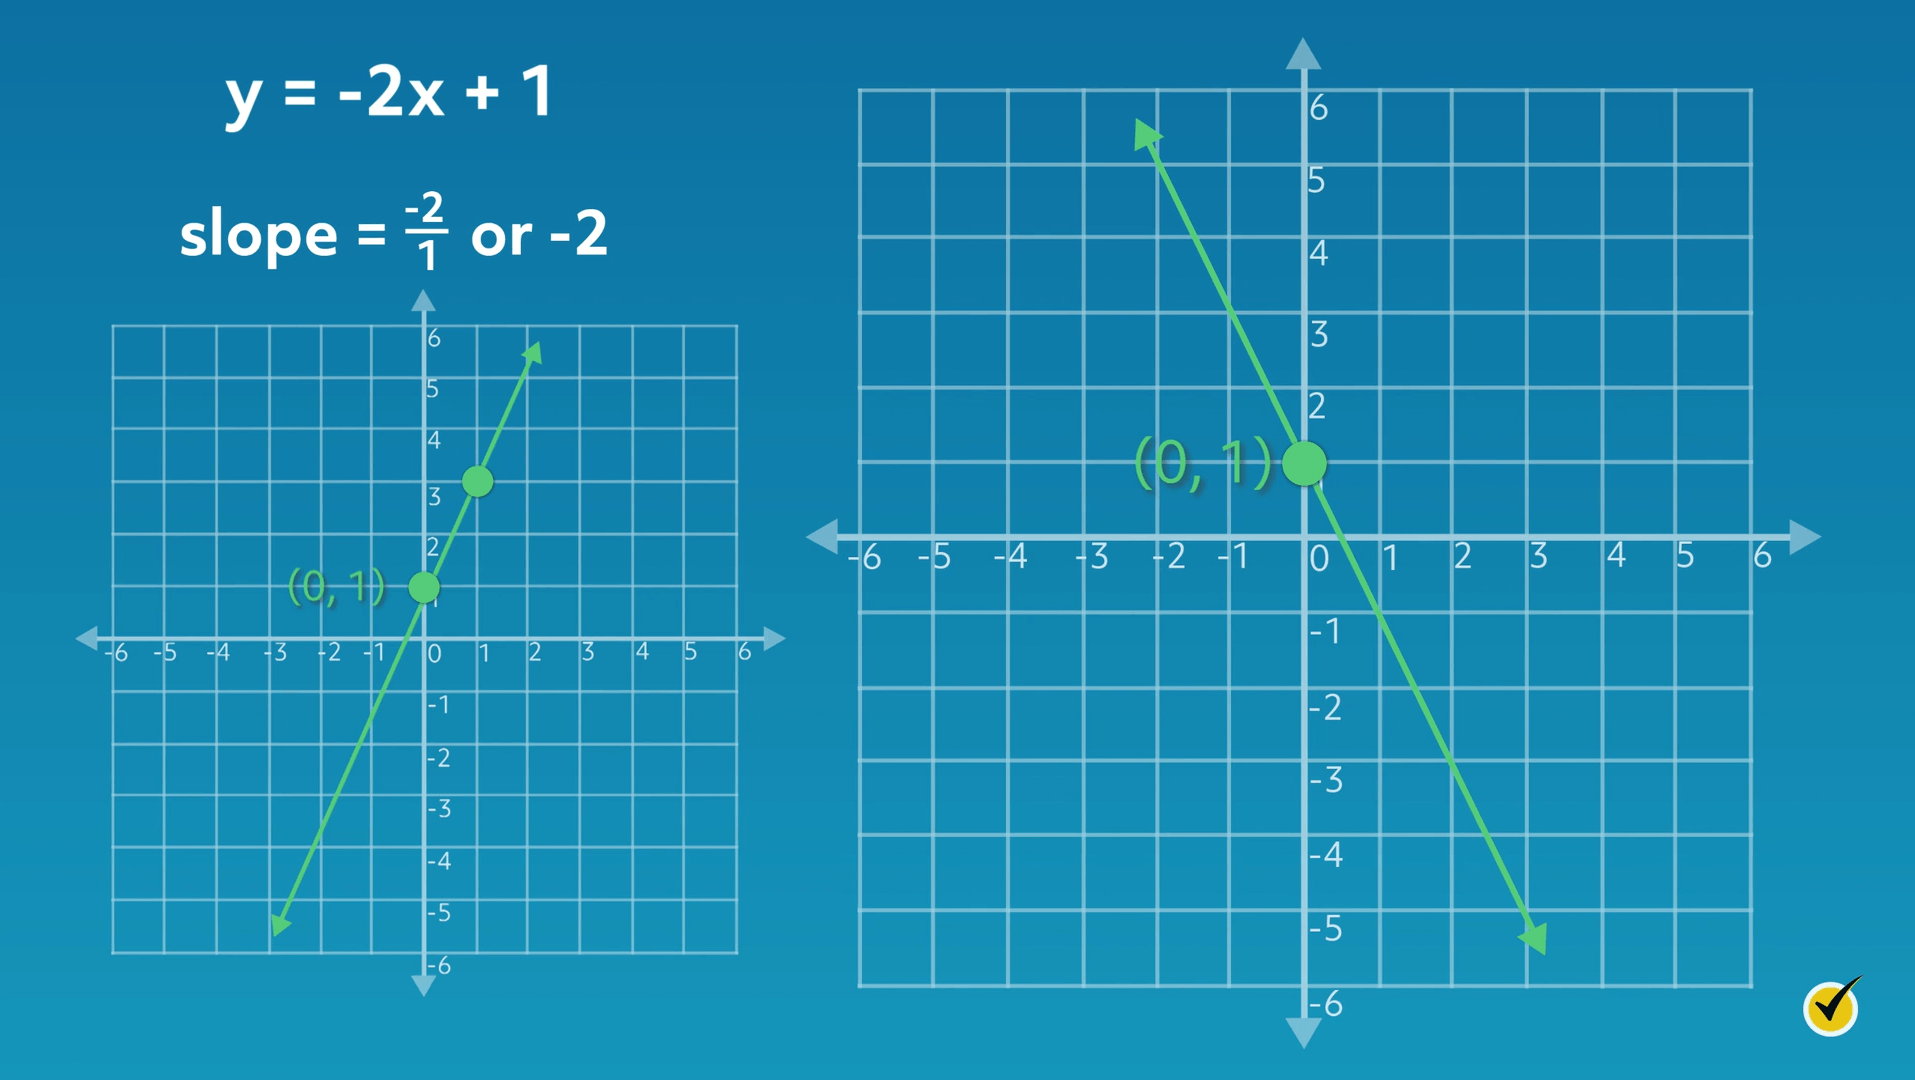
As you can see, the line in this graph moves in an opposite direction as compared to the first graph. Since the slope (\(m\)) is negative, the line moves in a negative direction.
The \(y\)-intercept (\(b\)) is \(1\), which is the same as our previous graph. The line crosses through the \(y\)-axis at \(1\), or \((0, 1)\). Our equation reflects this because the value for \(b\) is also 1.
From the \(y\)-intercept \((0, 1)\), plot the second point on the line by moving in a vertical direction (rise) and then a horizontal direction (run). Because the numerator of the slope is \(-2\), move \(2\) units down from the \(y\)-intercept. From there, move \(1\) unit to the right, as indicated by the slope’s denominator, \(1\).
Note: A positive “rise” moves up, and a negative “rise” moves down; a positive “run” moves right, and a negative “run” moves left.
Let’s examine another graph that changes the slope again.
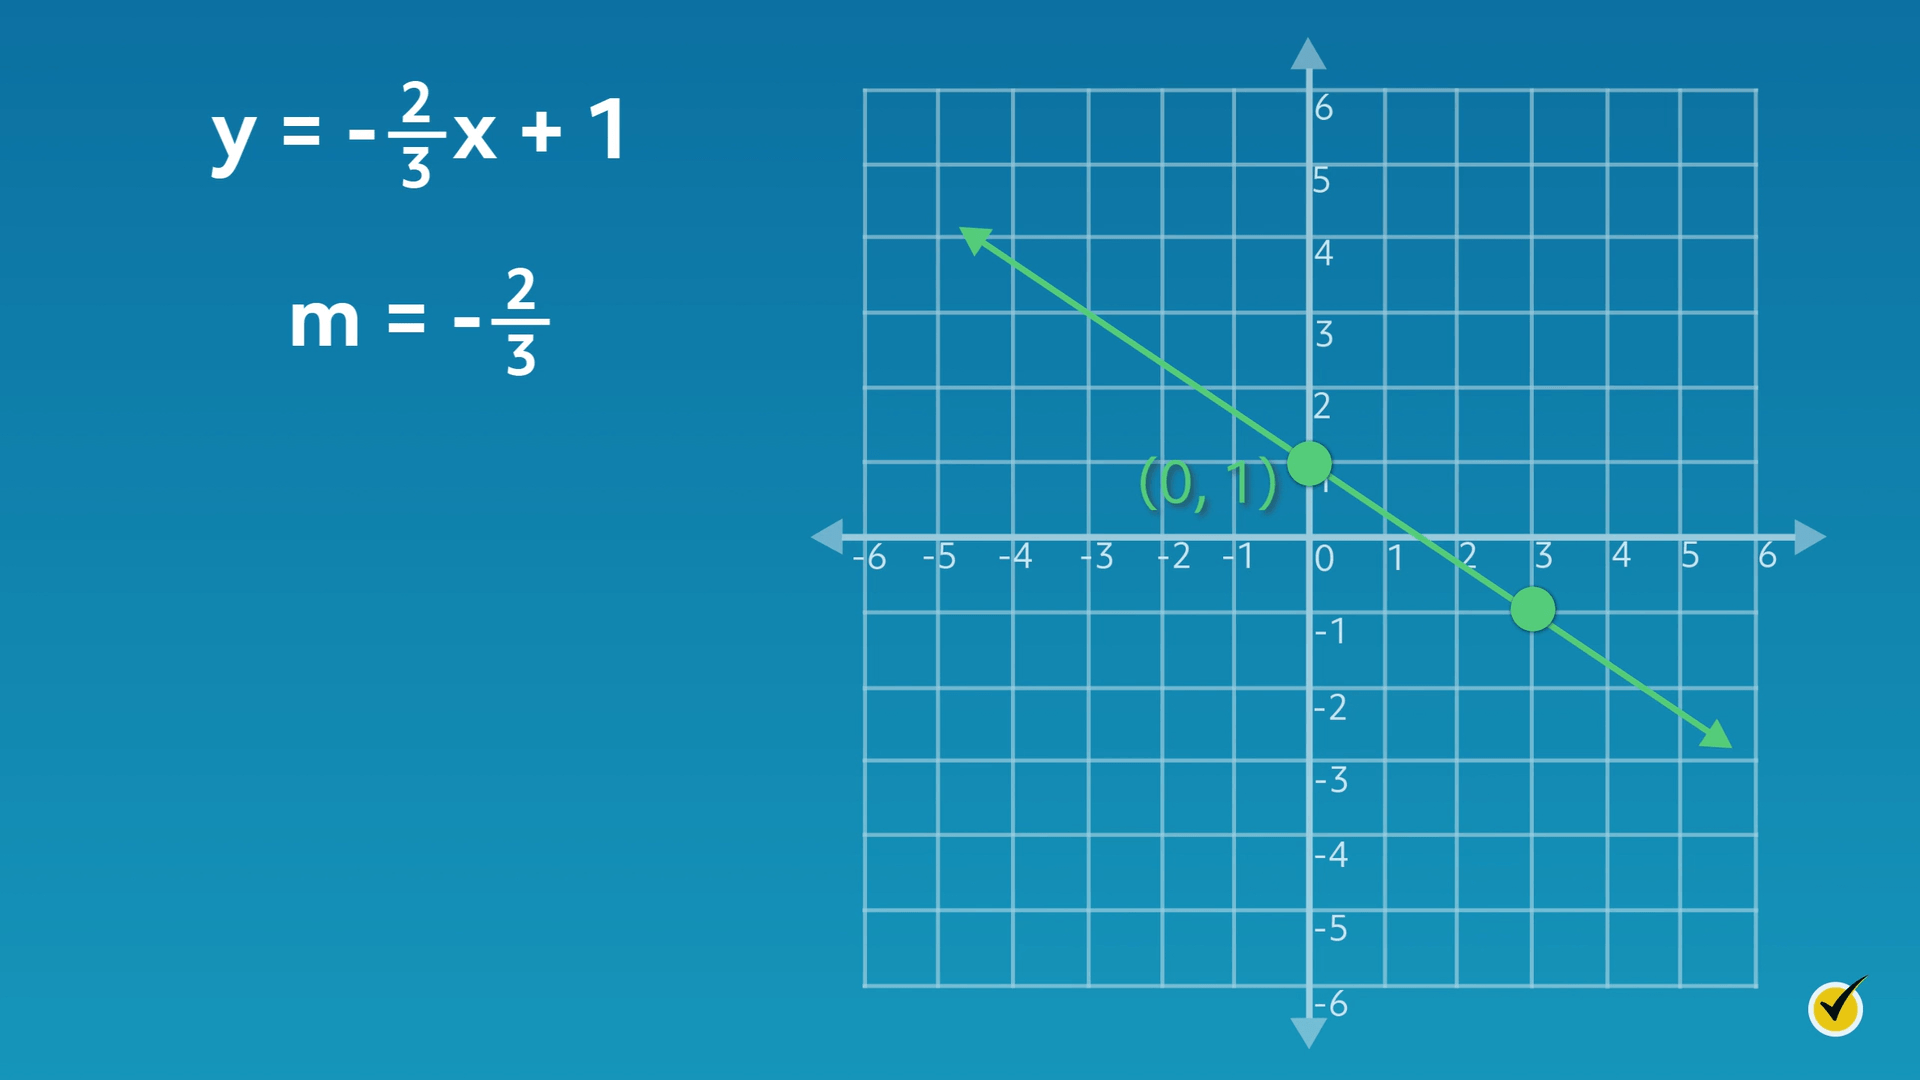
The equation for this graph is \(y=-\frac{2}{3}x+1\). This time, our slope is a fraction, \(-\frac{2}{3}\). Since the value of \(m\) is negative, this line moves in a negative direction. Our \(y\)-intercept value has not changed, so we still see that the line crosses through the \(y\)-axis at \(1\), or \((0, 1)\). Our equation reflects this because the value for \(b\) is also \(1\).
Notice how the steepness of this line is different. Compared to the last two graphs, this line is less steep. Let’s understand why that is. From the \(y\)-intercept \((0, 1)\), plot the second point on the line by moving in a vertical direction (rise) and then a horizontal direction (run). Since \(m=-\frac{2}{3}\), move two units down and three units to the right. From this example, we can see that the larger the slope’s denominator is, the less steep the line will be.
What if the value of the slope (\(m\)) was zero? Consider the equation \(y=0x + 1\). In this case, there is no rise or run because the value of \(m\) equals \(0\). There is a \(y\)-intercept at \(1\), or \((0, 1)\). When graphed, a line with a slope of zero is a horizontal line, as shown:
Based on this information, what would the graph for \(y=0x + 5\) look like? It would look like a horizontal line passing through the \(y\)-intercept of \(5\), or \((0, 5)\).
What would the graph for \(y=0x + 0\) look like? …That’s right, a horizontal line passing through the \(y\)-intercept of \(0\), or \((0,0)\).
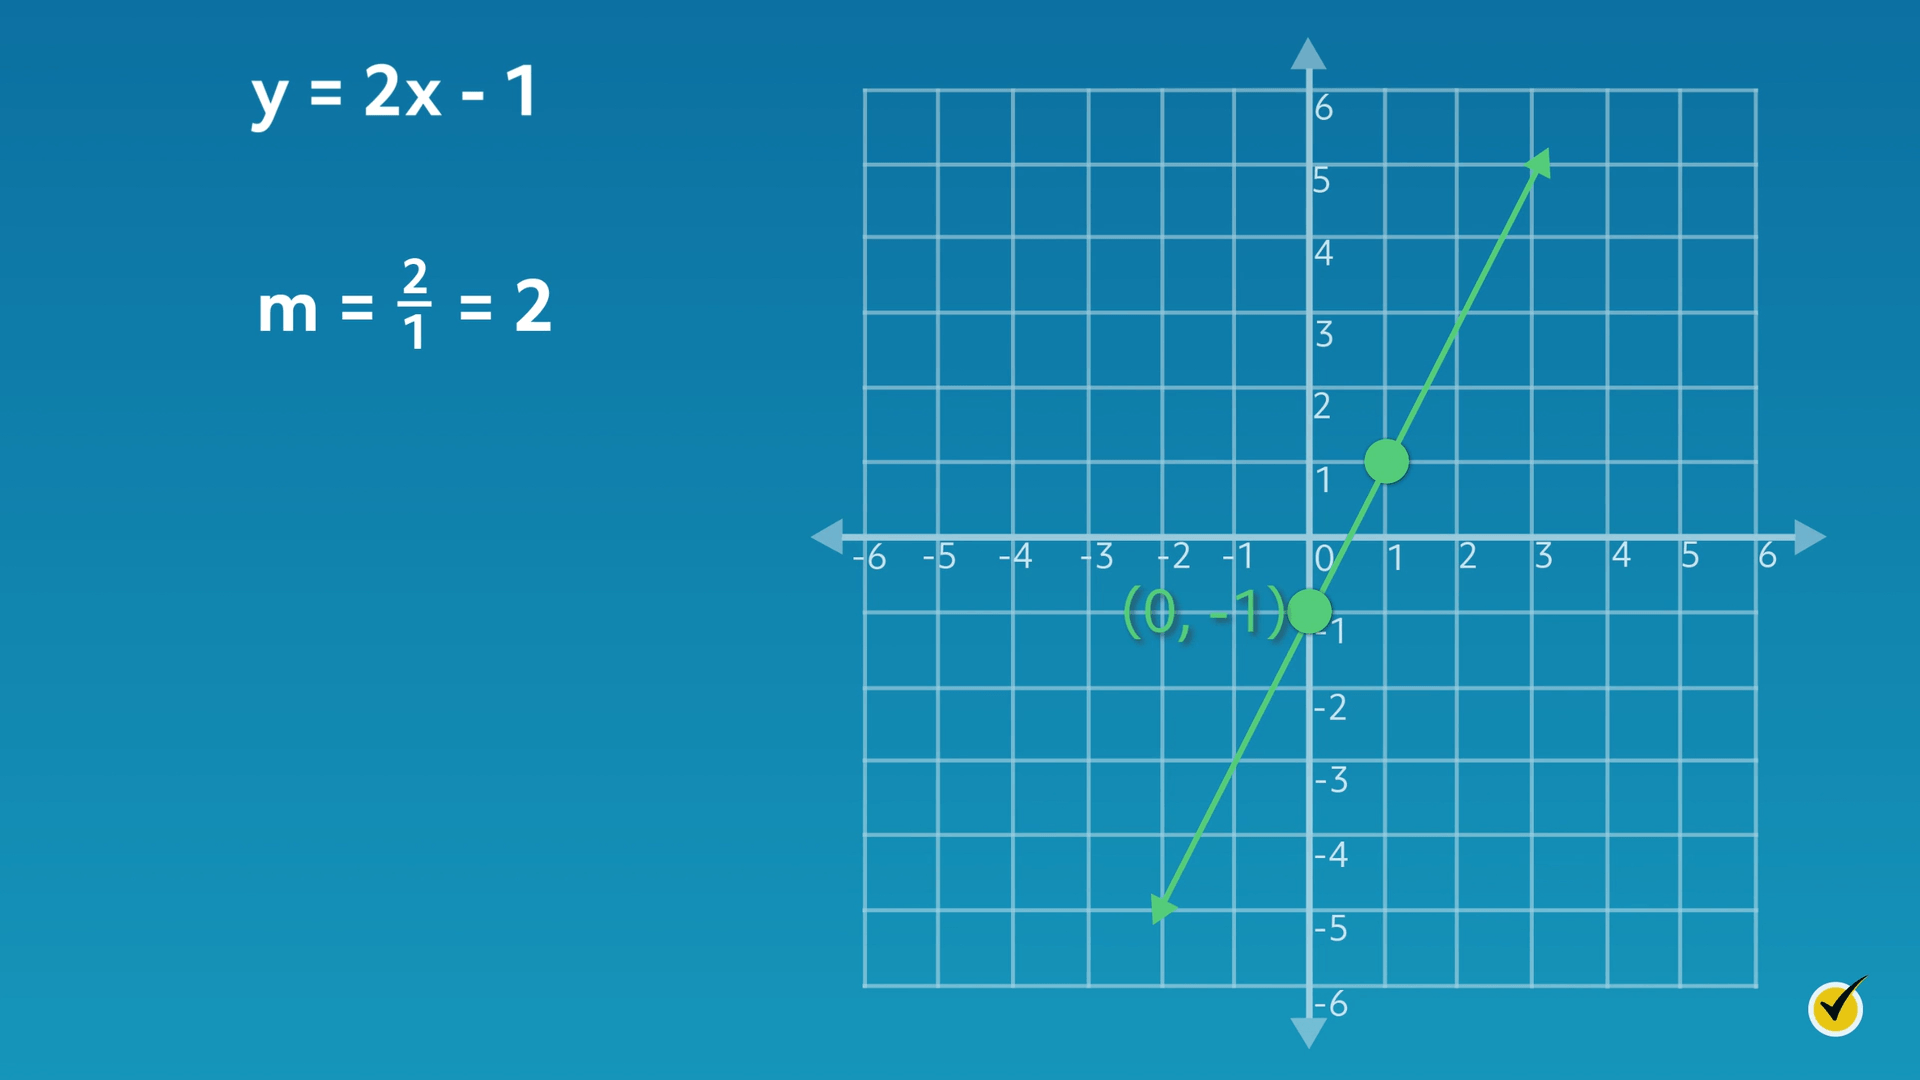
Now that we know what happens to the graph of a linear function when we change slope, let’s examine what happens when we change the \(y\)-intercept. Consider the graph for the equation \(y=2x – 1\).
Recall the first equation and graph we looked at, \(y=2x + 1\). The only difference in this equation is that the \(y\)-intercept (\(b\)) is a negative value, \(-1\). As a result, we see on our graph that the line intersects the \(y\)-axis at \(-1\), or \((0, -1)\).
From the \(y\)-intercept \((0, -1)\), the second point on the line is plotted by moving in a vertical direction (rise) and then a horizontal direction (run). Since \(m=\frac{2}{1}\), move two units up and one unit over to the right. Therefore, our slope (\(m\)) equals \(\frac{2}{1}\), which equals \(2\).
What do you think the graph would look like for a linear equation with a \(y\)-intercept value of zero? Let’s take a look. Consider the equation \(y=2x + 0\), which can also be written as \(y = 2x\):
As you can see, the line passes through the \(y\)-axis at the origin, or zero. Since the \(y\)-intercept (\(b\)) is \(0\), this makes sense.
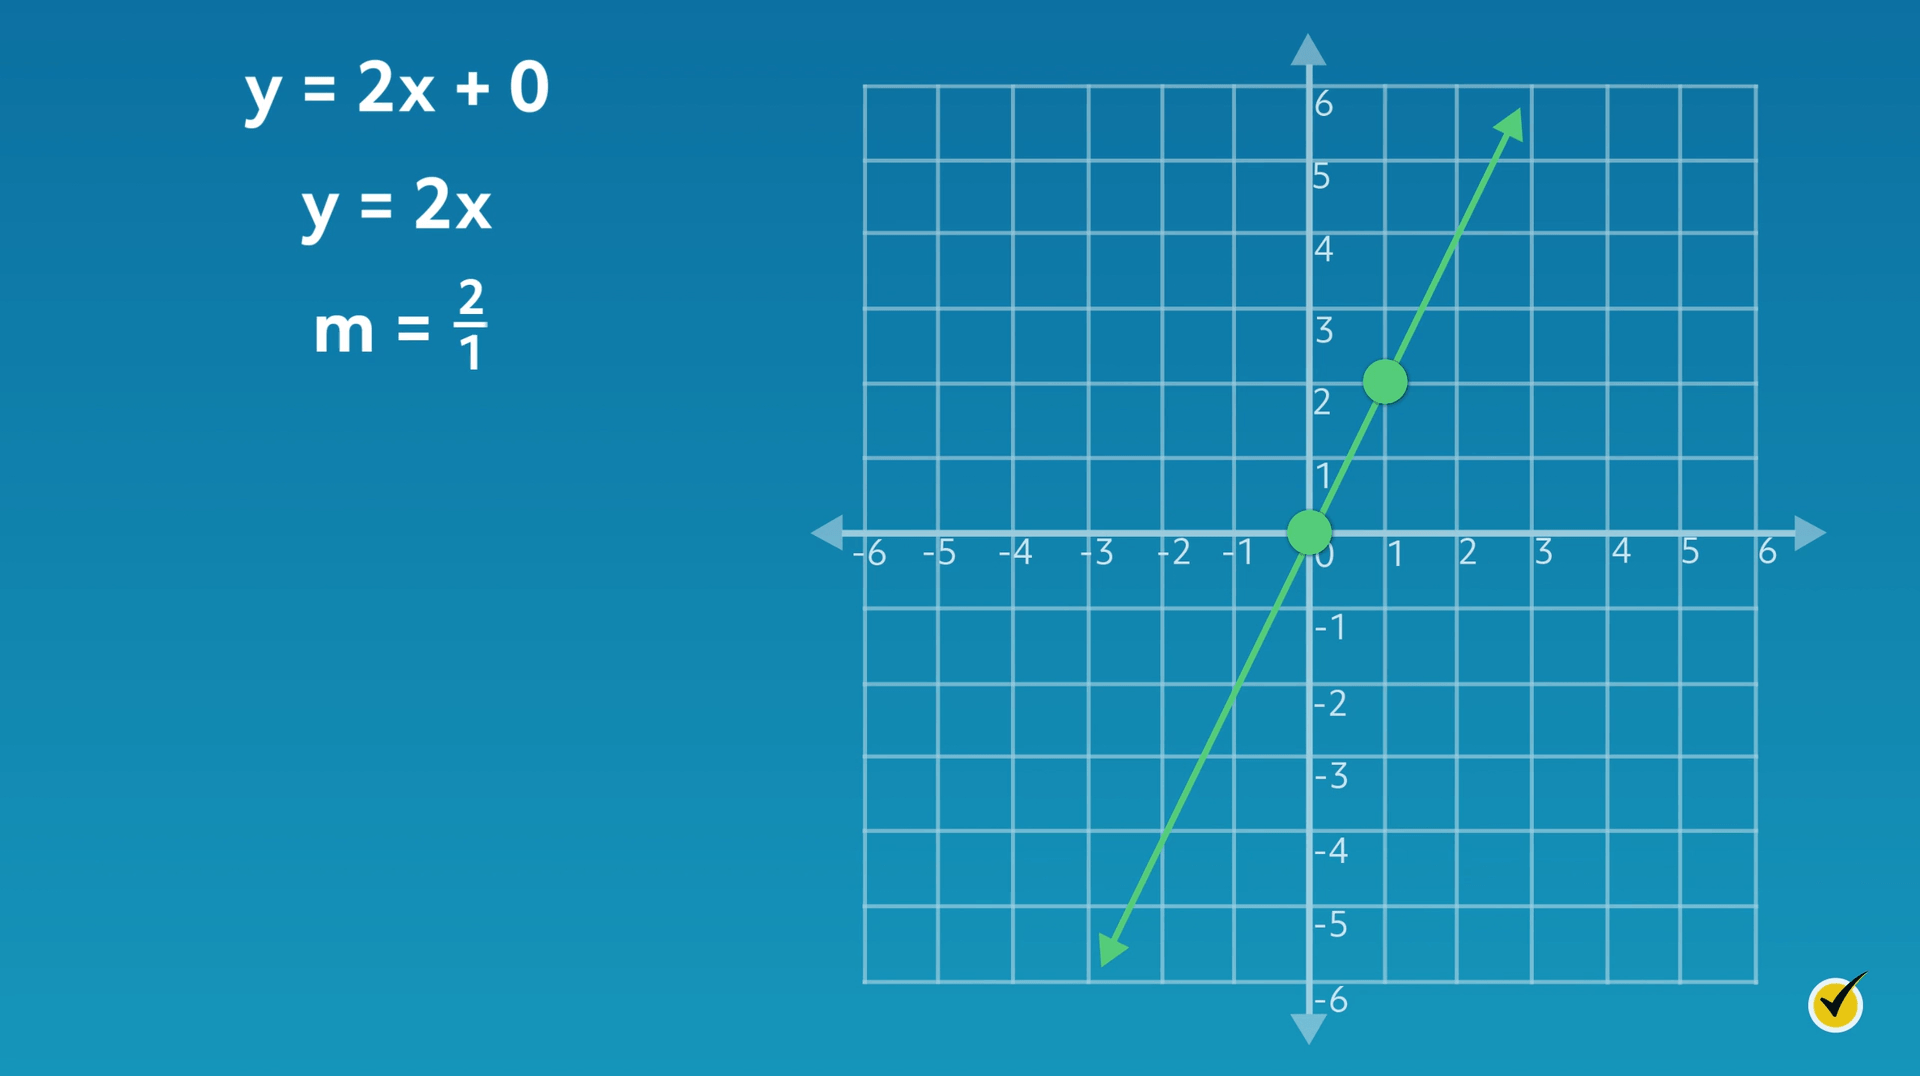
The slope (\(m\)) is \(\frac{2}{1}\). From the origin, move two units up (rise) and one unit over (run) to reach the next point on the line.
What if the \(y\)-intercept is a fraction? Consider the equation \(y=2x+\frac{1}{2}\):
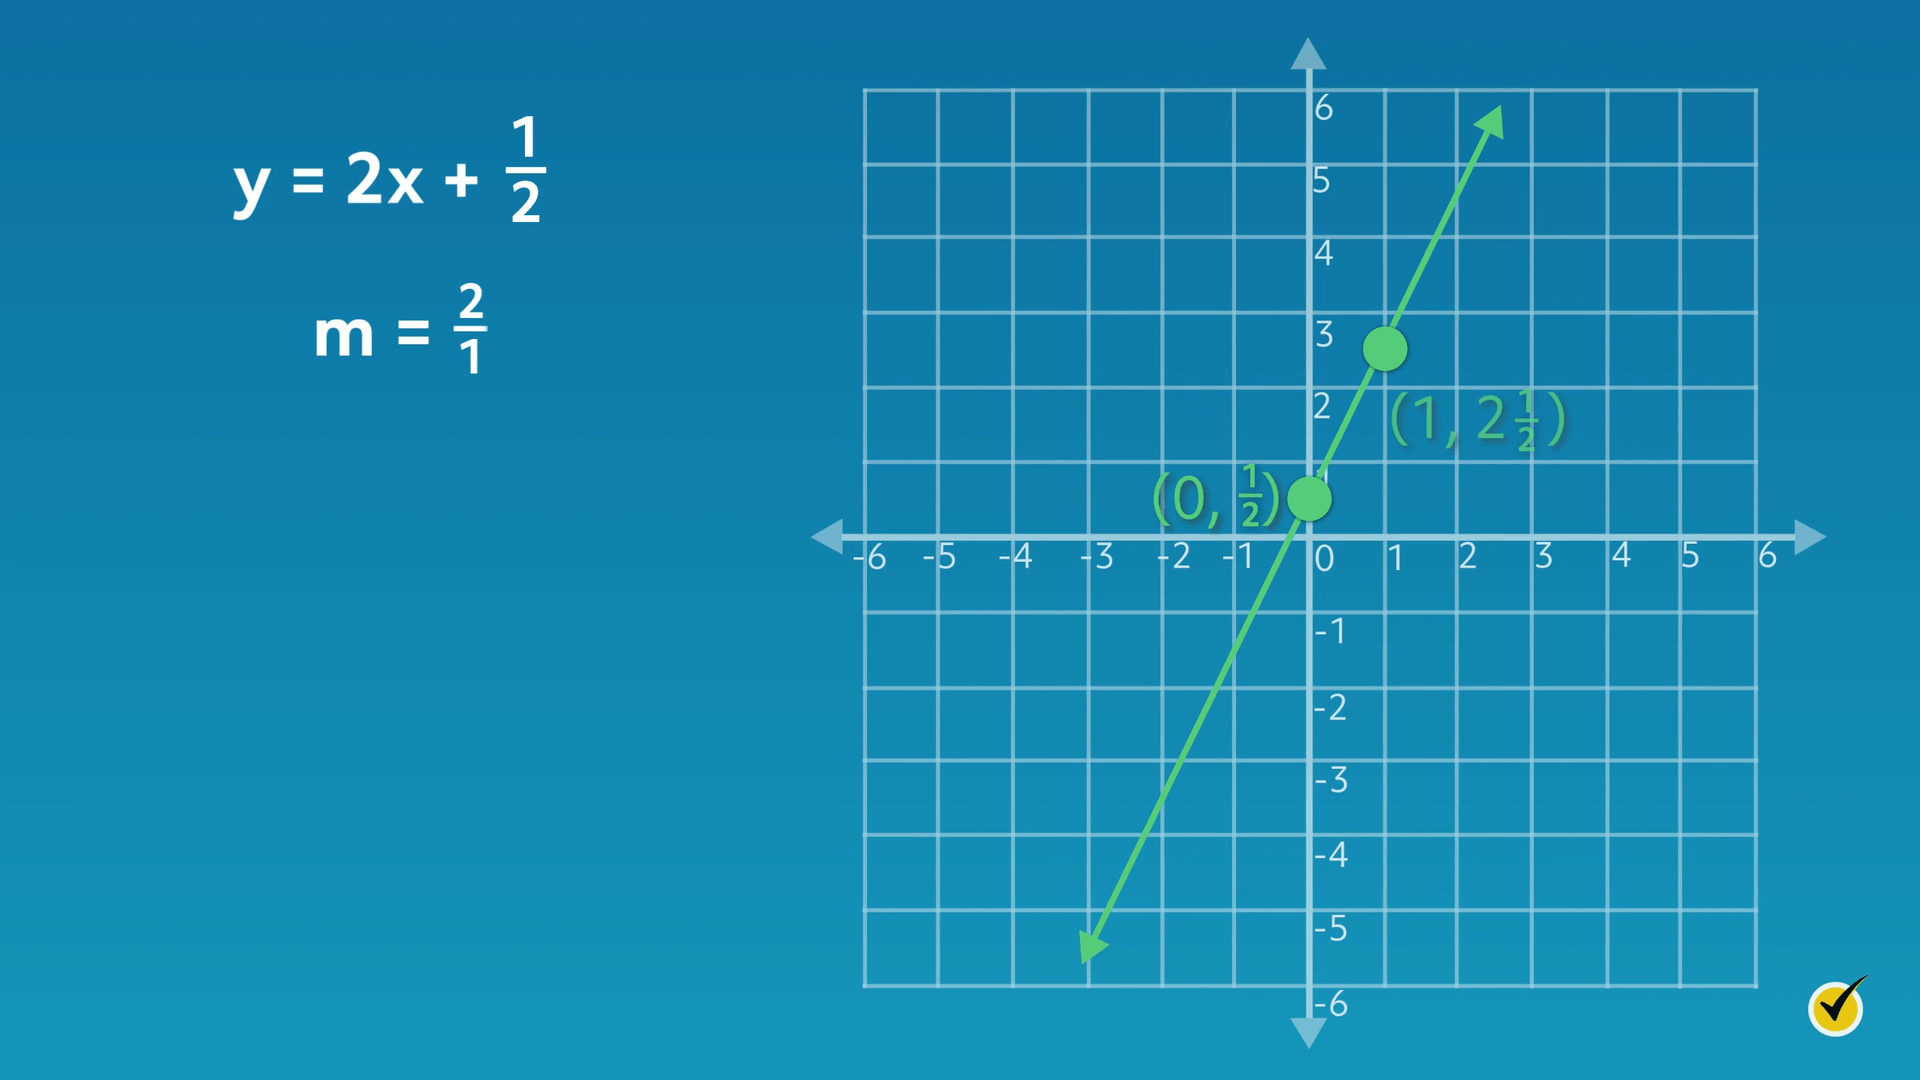
In this case, we see the line passes through the \(y\)-axis halfway between \(0\) and \(1\), at \(\frac{1}{2}\) or \((0, \frac{1}{2})\). If the \(y\)-intercept is a fractional value, then it will pass through the \(y\)-axis at the fractional value it represents.
The slope (\(m\)) is \(\frac{2}{1}\). From \((0,\frac{1}{2})\), move two units up (rise) and one unit over (run) to reach the next point, \((1,2\frac{1}{2})\).
We’re going to take a look at one final example. This time, you are going to try it on your own. The next graph will combine everything we’ve talked about so far. It’s a little more challenging, but I know you can handle it.
I’m going to give you the equation. Once you see the equation, pause the video, draw a coordinate plane, and see if you can graph the equation yourself. When you’re done, resume and we will go over the graph together.
The equation I want you to graph is \(y=-\frac{1}{4}x-3\):
Now that you’re ready to check your work, let’s take a look at the graph together.
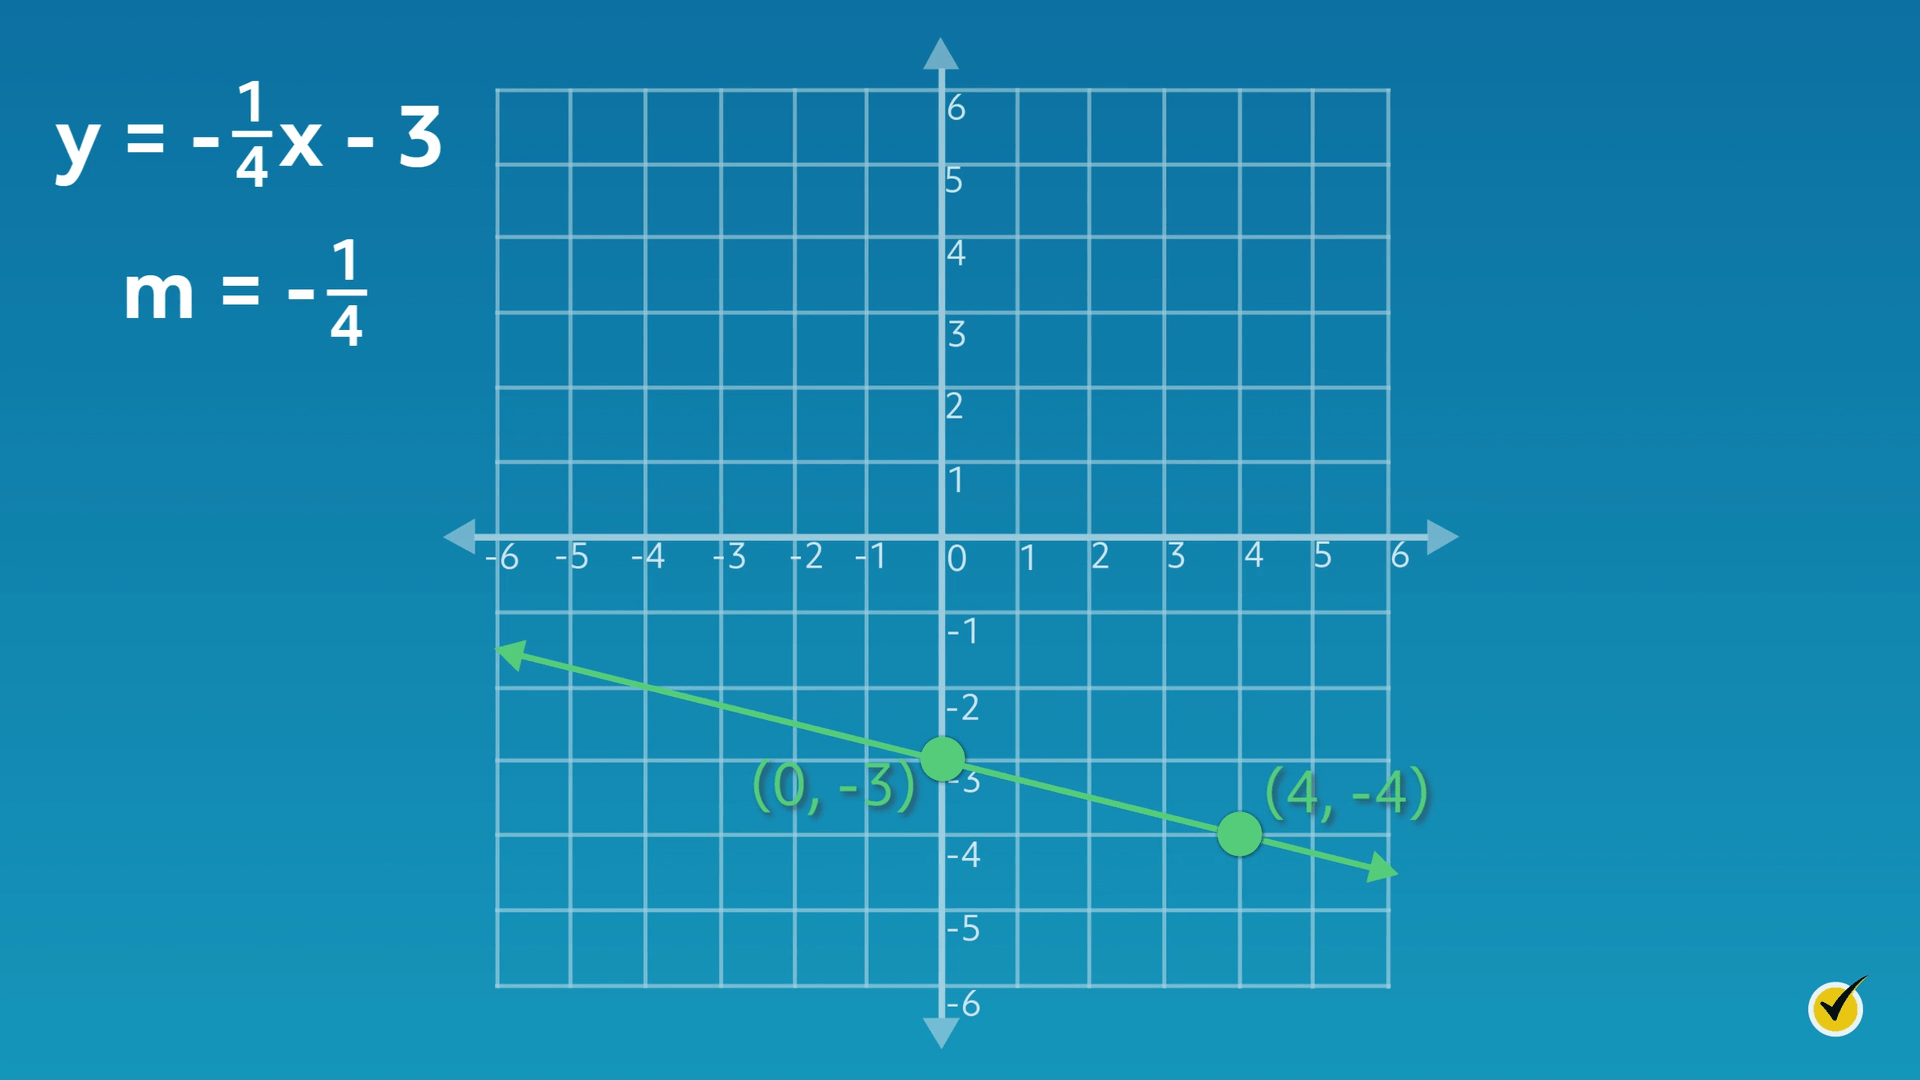
First, let’s take a look at the \(y\)-intercept (\(b\)). Recall that the value for \(b\) in our formula was \(-3\). That means that the line passes through the \(y\)-axis at \(-3\), or \((0, -3)\).
Now that we’ve graphed our \(y\)-intercept point, let’s consider the slope. The value for the slope (\(m\)) in the formula is \(-\frac{1}{4}\). So, from the \(y\)-intercept point, we need to move down \(1\) unit and right \(4\) units. This brings us to the next point on the graph, which is \((4, -4)\).
Understanding how constants work helps mathematicians recognize patterns in graphs of linear functions. I hope that this video about changing constants in graphs of linear functions was helpful. Thanks for watching, and happy studying!
Graphing Linear Function Practice Questions
The graph below shows the linear function \(y=3x+1\). This equation is in the form \(y=mx+b\). What would happen to the line if \(b\) was changed to 8?
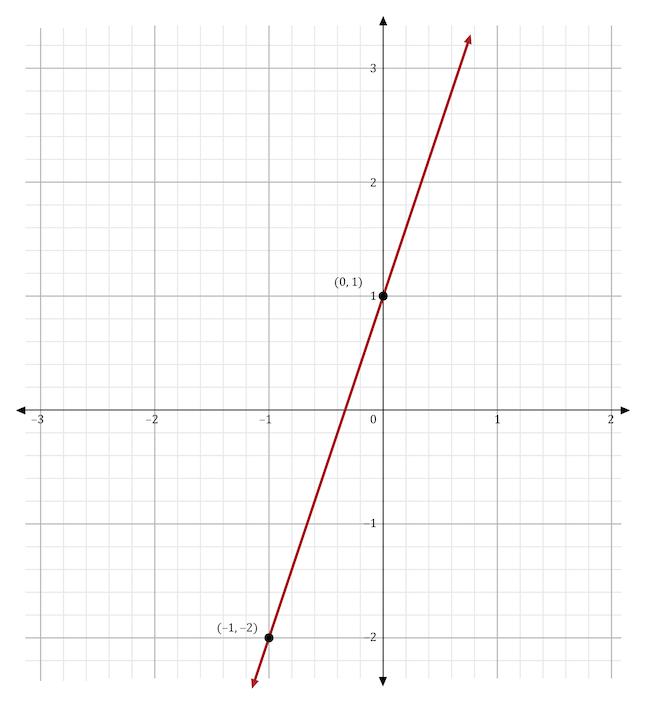
The line would intersect the \(y\)-axis at 8.
The line would intersect the \(x\)-axis at 8.
The line would have a slope of 8, increasing its steepness.
The line would have a slope of -8, changing its direction and increasing its steepness.
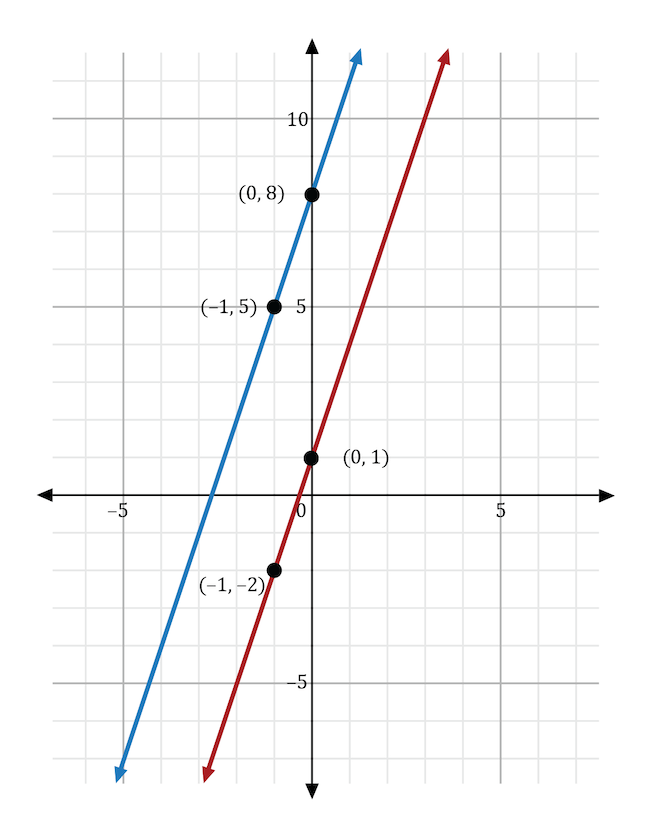
The variable \(b\) stands for the \(y\)-intercept in the slope-intercept form of the equation, \(y=mx+b\). If the \(y\)-intercept was changed from 1 to 8, then the resulting line would intersect the \(y\)-axis at 8. In the graph shown below, the original function (in red) shows the line intersecting the \(y\)-axis at 1. The new function (in blue) shows the line intersecting the \(y\)-axis at 8.
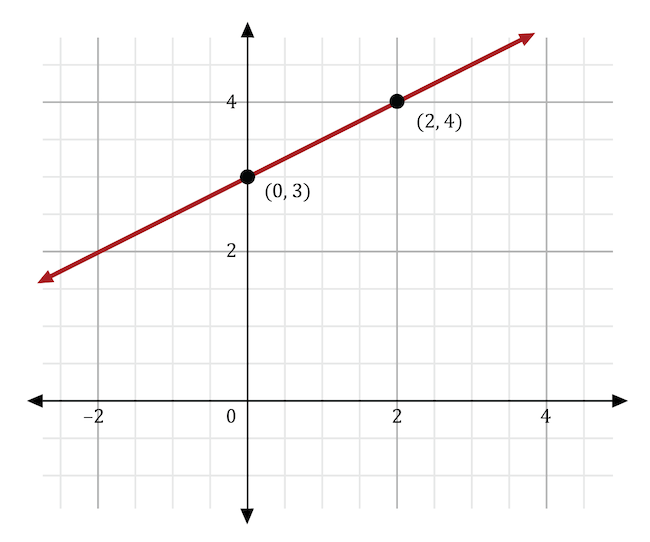
The graph below shows the linear function \(y=\frac{1}{2}x+3\). This equation is in the form \(y=mx+b\). What would happen to the line if \(m\) was changed to \(-\frac{1}{2}\)?
The line would have a slope of \(-\frac{1}{2}\), changing its direction from negative to positive.
The line would have a slope of \(-\frac{1}{2}\), changing its direction from positive to negative.
The line would intersect the \(y\)-axis at \(-\frac{1}{2}\).
The line would intersect the x-axis at \(-\frac{1}{2}\).
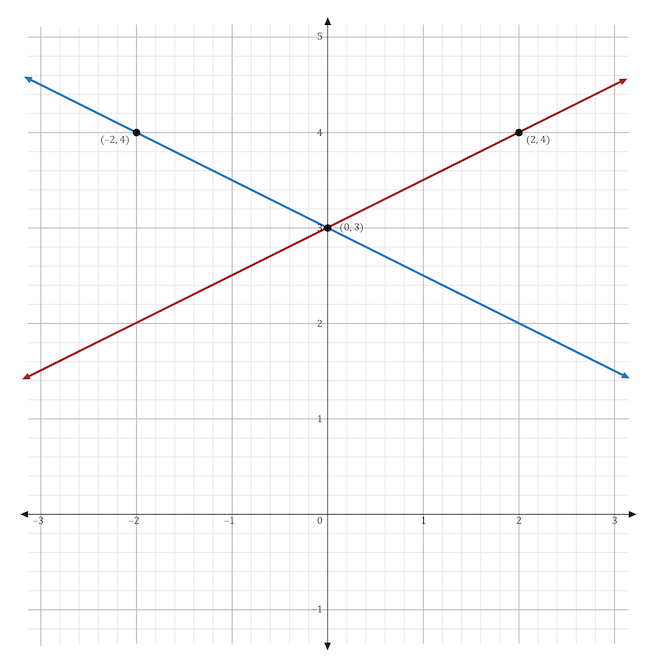
The variable \(m\) stands for the slope in the slope-intercept form of the equation, \(y=mx+b\). If the slope was changed from \(\frac{1}{2}\) to \(-\frac{1}{2}\), then the direction of the line would change from positive to negative. In the graph shown below, the original function (in red) shows a line moving in a positive direction. The new function (in blue) shows a line moving in a negative direction.
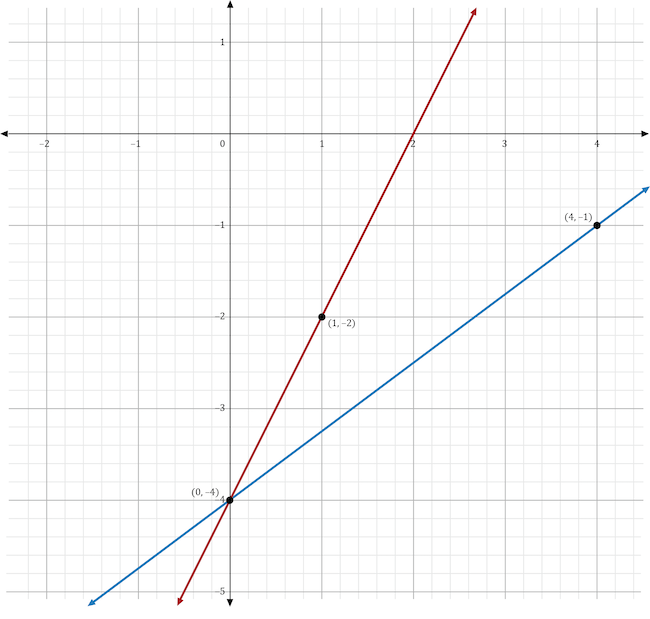
The graph below shows the linear function \(y=2x-4\). This equation is in the form \(y=mx+b\). What would happen to the line if m was changed to \(\frac{3}{4}\)?
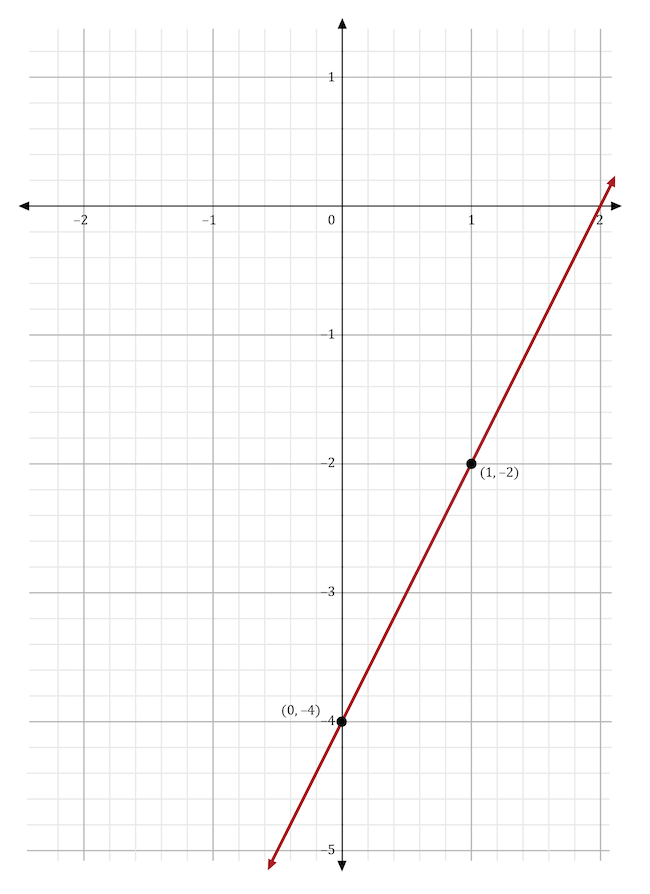
The line would have a slope of \(\frac{3}{4}\), increasing its steepness.
The line would have a slope of \(\frac{3}{4}\), decreasing its steepness.
The line would intersect the \(y\)-axis at \(\frac{3}{4}\).
The line would intersect the \(x\)-axis at \(\frac{3}{4}\).
The variable \(m\) stands for the slope in the slope-intercept form of the equation, \(y=mx+b\). If the slope was changed from 2 to \(\frac{3}{4}\), then the line’s slope would become less steep. In the graph shown below, the original function (in red) shows a line with a slope of 2. The new function (in blue) shows a line with a slope of \(\frac{3}{4}\), which is less steep than the original line.
Maria graphed the linear function \(y=6x+2\) onto the coordinate plane, as shown below. She wants to adjust her equation to make her line less steep. She also wants to move the \(y\)-intercept further down. Which equation should Maria use to reflect these changes?
In the slope-intercept equation \(y=mx+b\), \(m\) stands for the slope and \(b\) stands for the \(y\)-intercept. For the slope to be less steep than the original line, \(m\) must have a value that is less than 6. To move the \(y\)-intercept further down on the coordinate plane, \(b\) must be less than 2. The equation that satisfies both these requirements is \(y=\frac{1}{2}x-3\). On the graph shown below, the original function, \(y=6x+2\), is shown in red, and the new function, \(y=\frac{1}{2}x-3\), is shown in blue. The blue line has a less steep slope and a lower \(y\)-intercept than the red line.
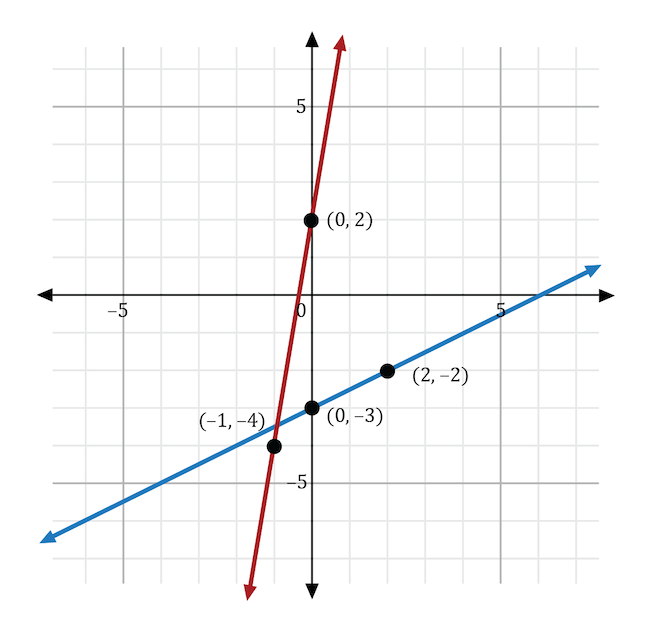
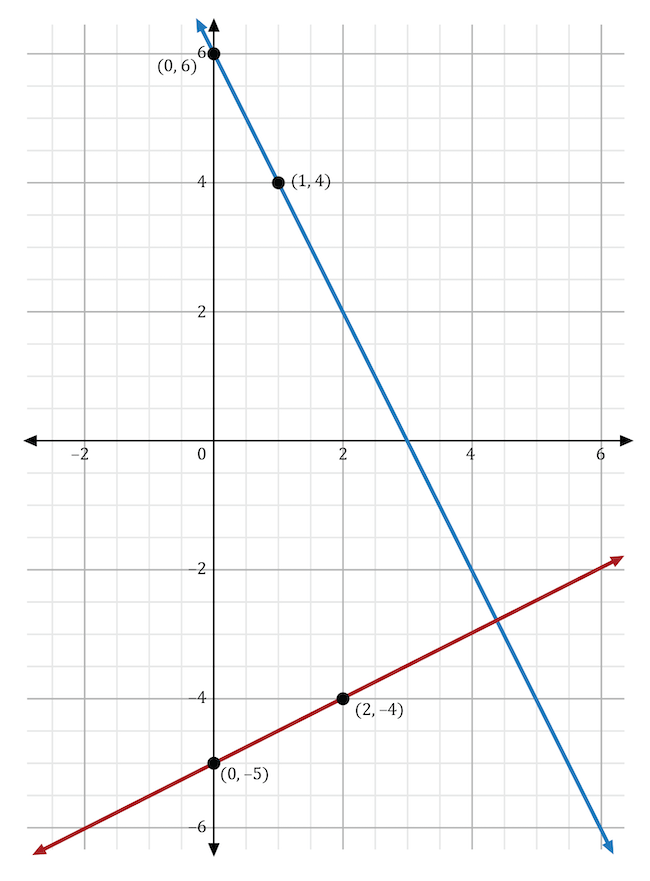
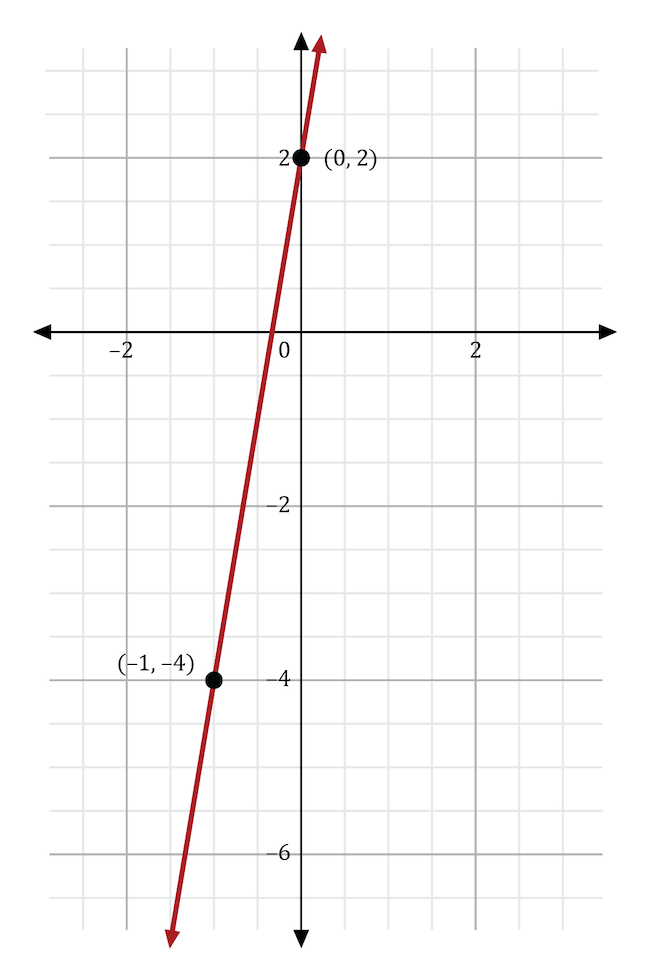
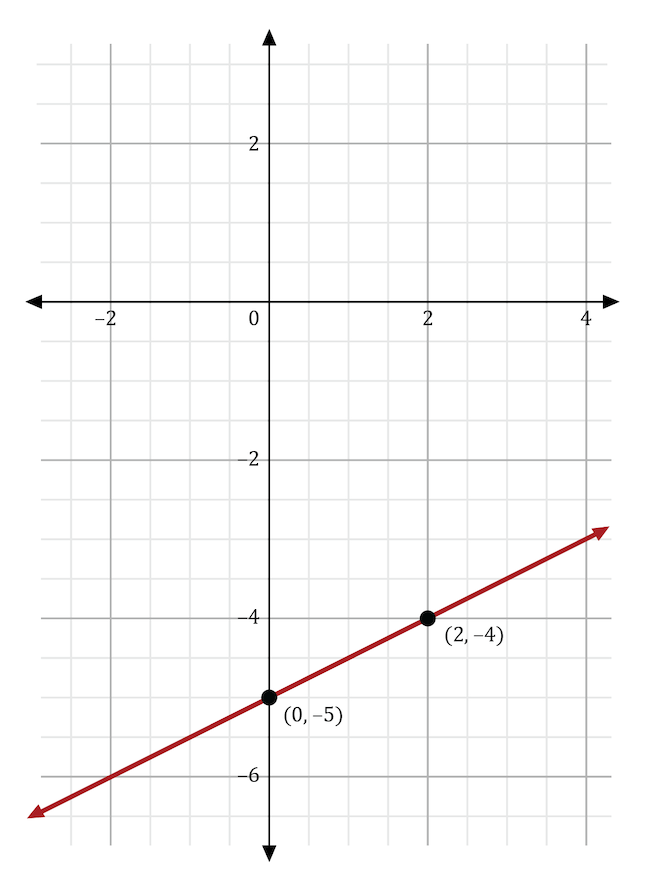
Jacob graphed the linear function \(y=\frac{1}{2}x-5\) onto the coordinate plane, as shown below. He wants to adjust his equation to change the direction of the line, increase its steepness, and move the \(y\)-intercept further up. Which equation should Jacob use to reflect all these changes?
In the slope-intercept equation \(y=mx+b\), \(m\) stands for the slope and \(b\) stands for the \(y\)-intercept. To write an equation that changes the direction of the line, \(m\) must be negative since the original slope was positive. To increase the line’s steepness, the absolute value of \(m\) must be greater than that of the original slope, which is \(\frac{1}{2}\). To move the \(y\)-intercept further up on the coordinate plane, \(b\) must be greater than -5. The equation that satisfies all these requirements is \(y=-2x+6\). On the graph shown below, the original function, \(y=\frac{1}{2}x-5\), is shown in red, and the new function, \(y=-2x+6\), is shown in blue. The blue line has a steeper slope than the red line and moves in a negative direction. The blue line also has a higher \(y\)-intercept than the red line.