What is Rate of Change?
Imagine you are driving in a car and that after one hour, you have traveled 30 miles. After a second hour, you have traveled an additional 45 miles, and after a third hour, 75 more miles. Say we are interested in finding out your average speed, or in other words, your rate of change, over those three hours. In this example, your average rate of change would be 50 miles per one hour. In this overview, we will discuss how to calculate the rate of change of a function, as well as how we classify those rates.
How to Calculate Rate of Change
In order to calculate rate of change for a function \(f(x)\), select two points \(a\) and \(b\) on the \(x\)-axis, where \(b\) is greater than (or to the right of) \(a\). We evaluate the function at those two points and take their difference, \(f(b)-f(a)\), to determine how much height the function gains or loses. We then take the difference \(b-a\) to determine how far we are moving along the \(x\)-axis. Finally, we divide the change in height by the change along the \(x\)-axis to calculate the ratio used for rate of change:
\(\frac{f(b)-f(a)}{b-a}=\frac{\text{change in height}}{\text{change along the x-axis}}=\text{ rate of change}\)
Notice in the following illustration that \(fa\) and \(fb\) represent \(y\)-values and help us determine change in height, while \(a\) and \(b\) are \(x\)-values which help us determine change along the horizontal \(x\)-axis. 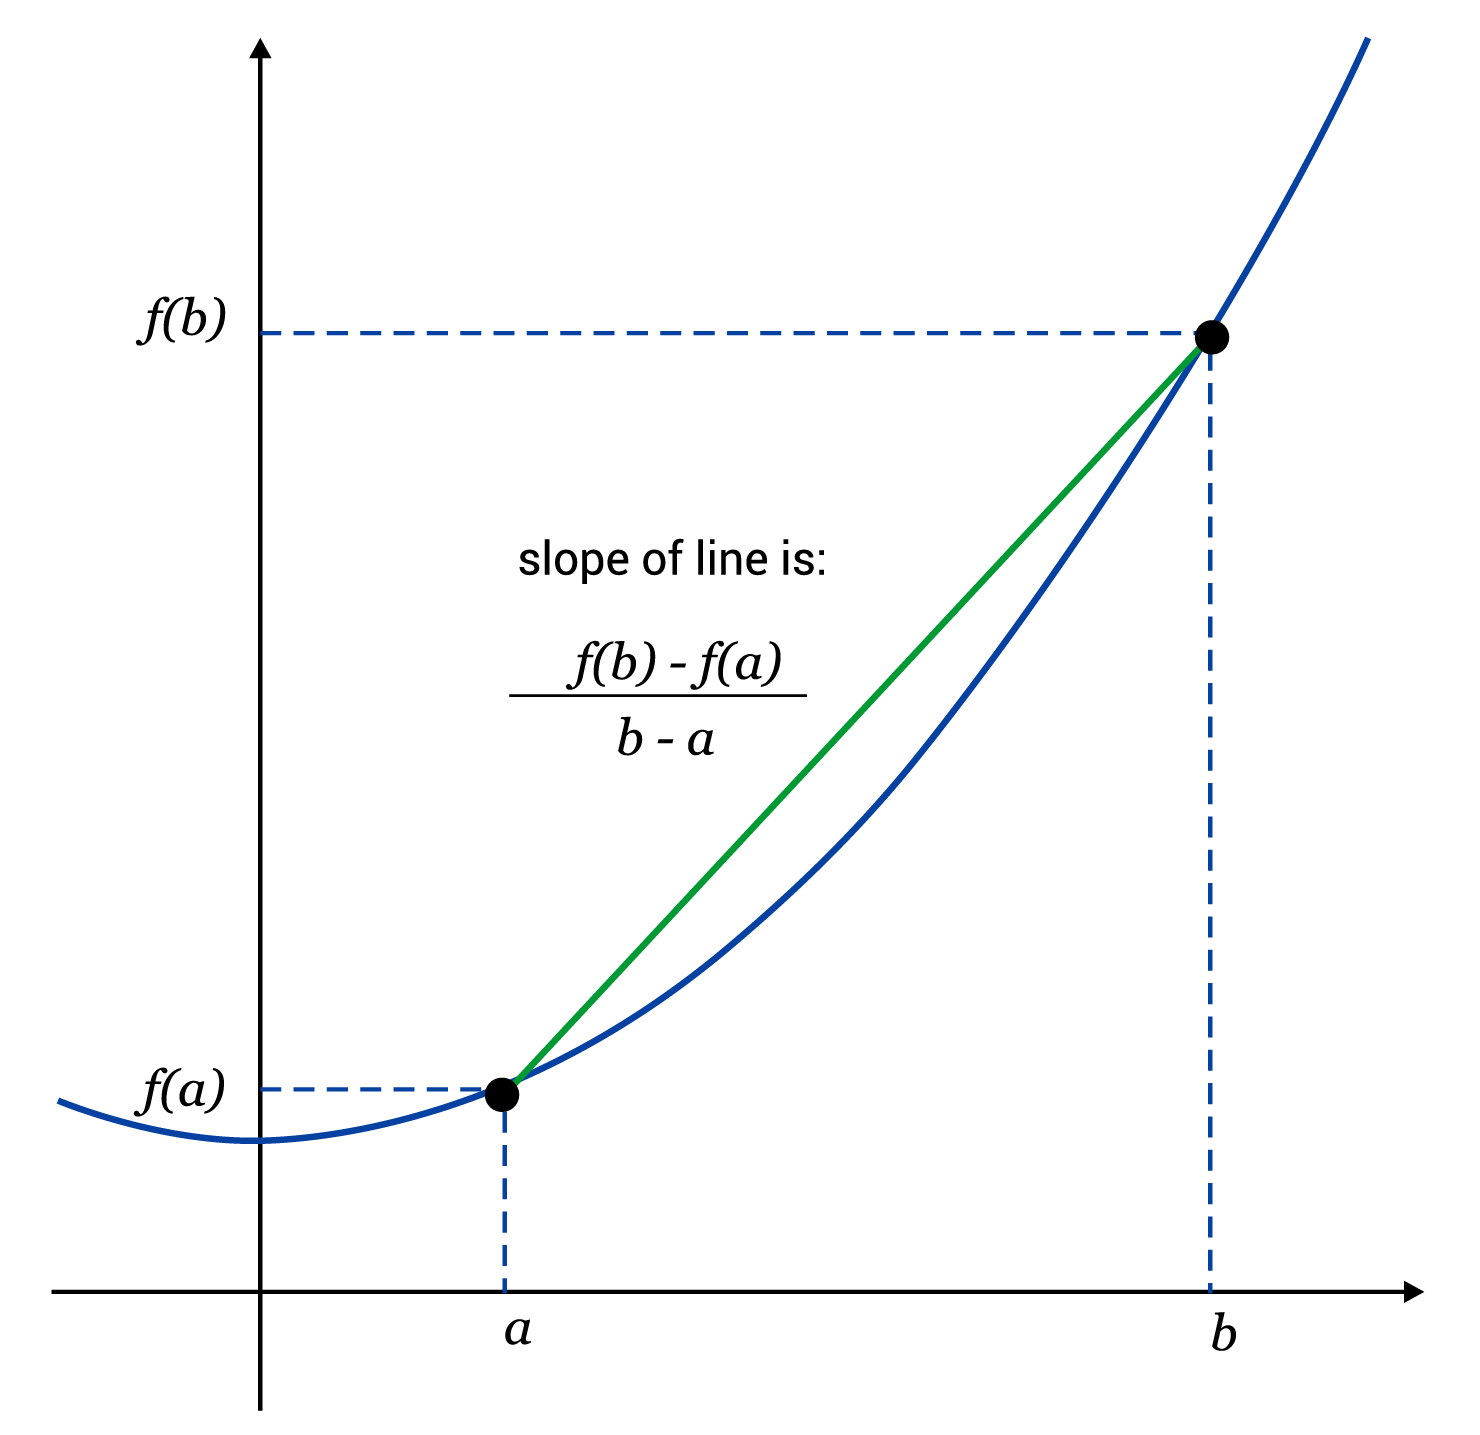
Positive, Negative, and Zero Rate of Change
Rate of change helps us to see and understand how a function is generally behaving. Is it gaining height overall? Going down? Some functions, like \(\text{sin}(x)\) and \(\text{cos}(x)\), which are oscillating functions, could even have zero net change!
It is not surprising that we classify rates of change as positive, negative, and zero in order to indicate these general behaviors. For example, let’s consider the function \(f(x)=x^3\). If we select two points along the \(x\)-axis, say 0 and 2, then evaluate at those points, we get \(f(0)=0^3=0\), and \(f(2)=2^3=8\). In order to find the rate of change, we use the formula from above.
\(\frac{f(b)-f(a)}{b-a}=\frac{f(2)-f(0)}{2-0}=\frac{8-0}{2-0}=\frac{8}{2}=4\)
For the function \(f(x)=x^3\), the rate of change from \(x=0\) to \(x=2\) is equal to 4. This means that along the section given, the function on average gains 4 units of height for each 1 unit advanced horizontally. In the image below, the blue line shows \(f(x)=x^3\), while the yellow line depicts the rate of change.
Notice that the yellow lines endpoints intersect the blue line at \((0,0)\) and \((2,8)\) and simply connect them with a straight line. If we are given a graph to begin with, we can pick out those points of intersection and use them to find the rate of change more quickly. 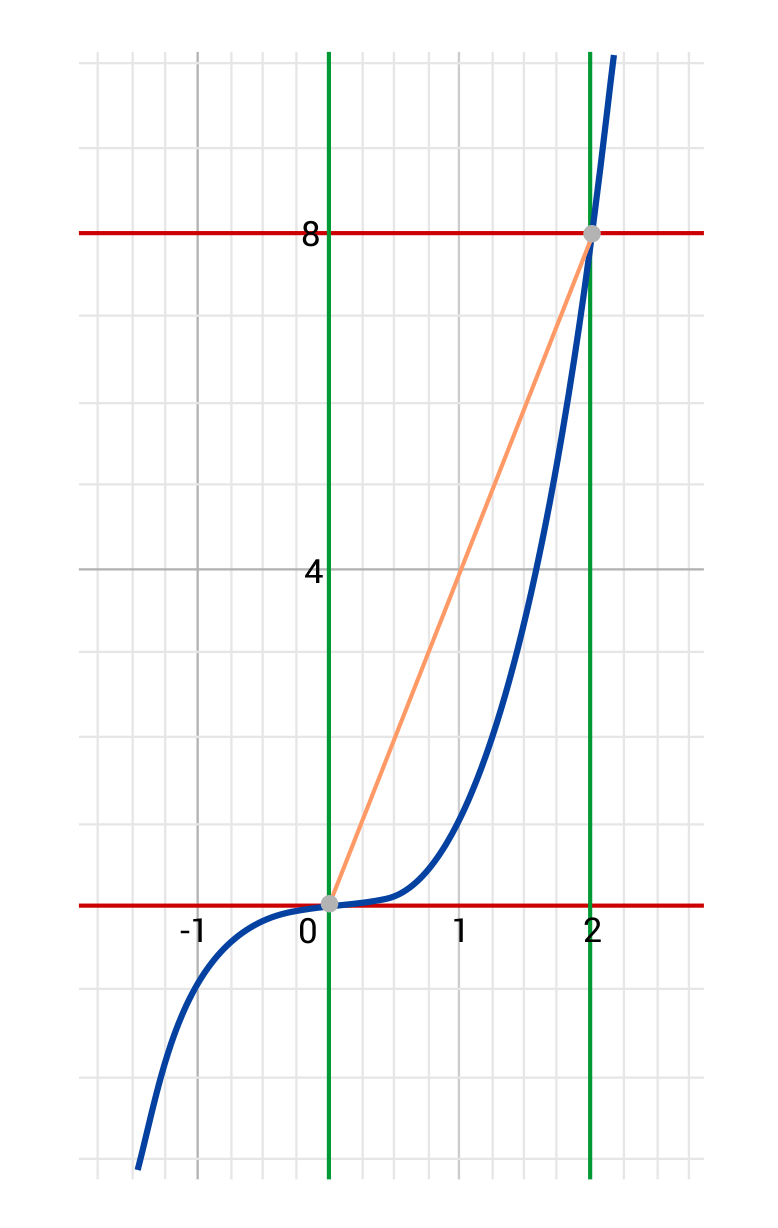 From the points \((0,0)\) and \((2,8)\), \(\frac{\text{difference of y-values}}{\text{difference of x-values}}=\frac{∆x}{∆y}=\frac{8-0}{2-0}=\frac{8}{2}=4\). It is helpful to note that when we talk about differences in x- and y-values, we frequently use the shorthand \(∆x\) and \(∆y\).
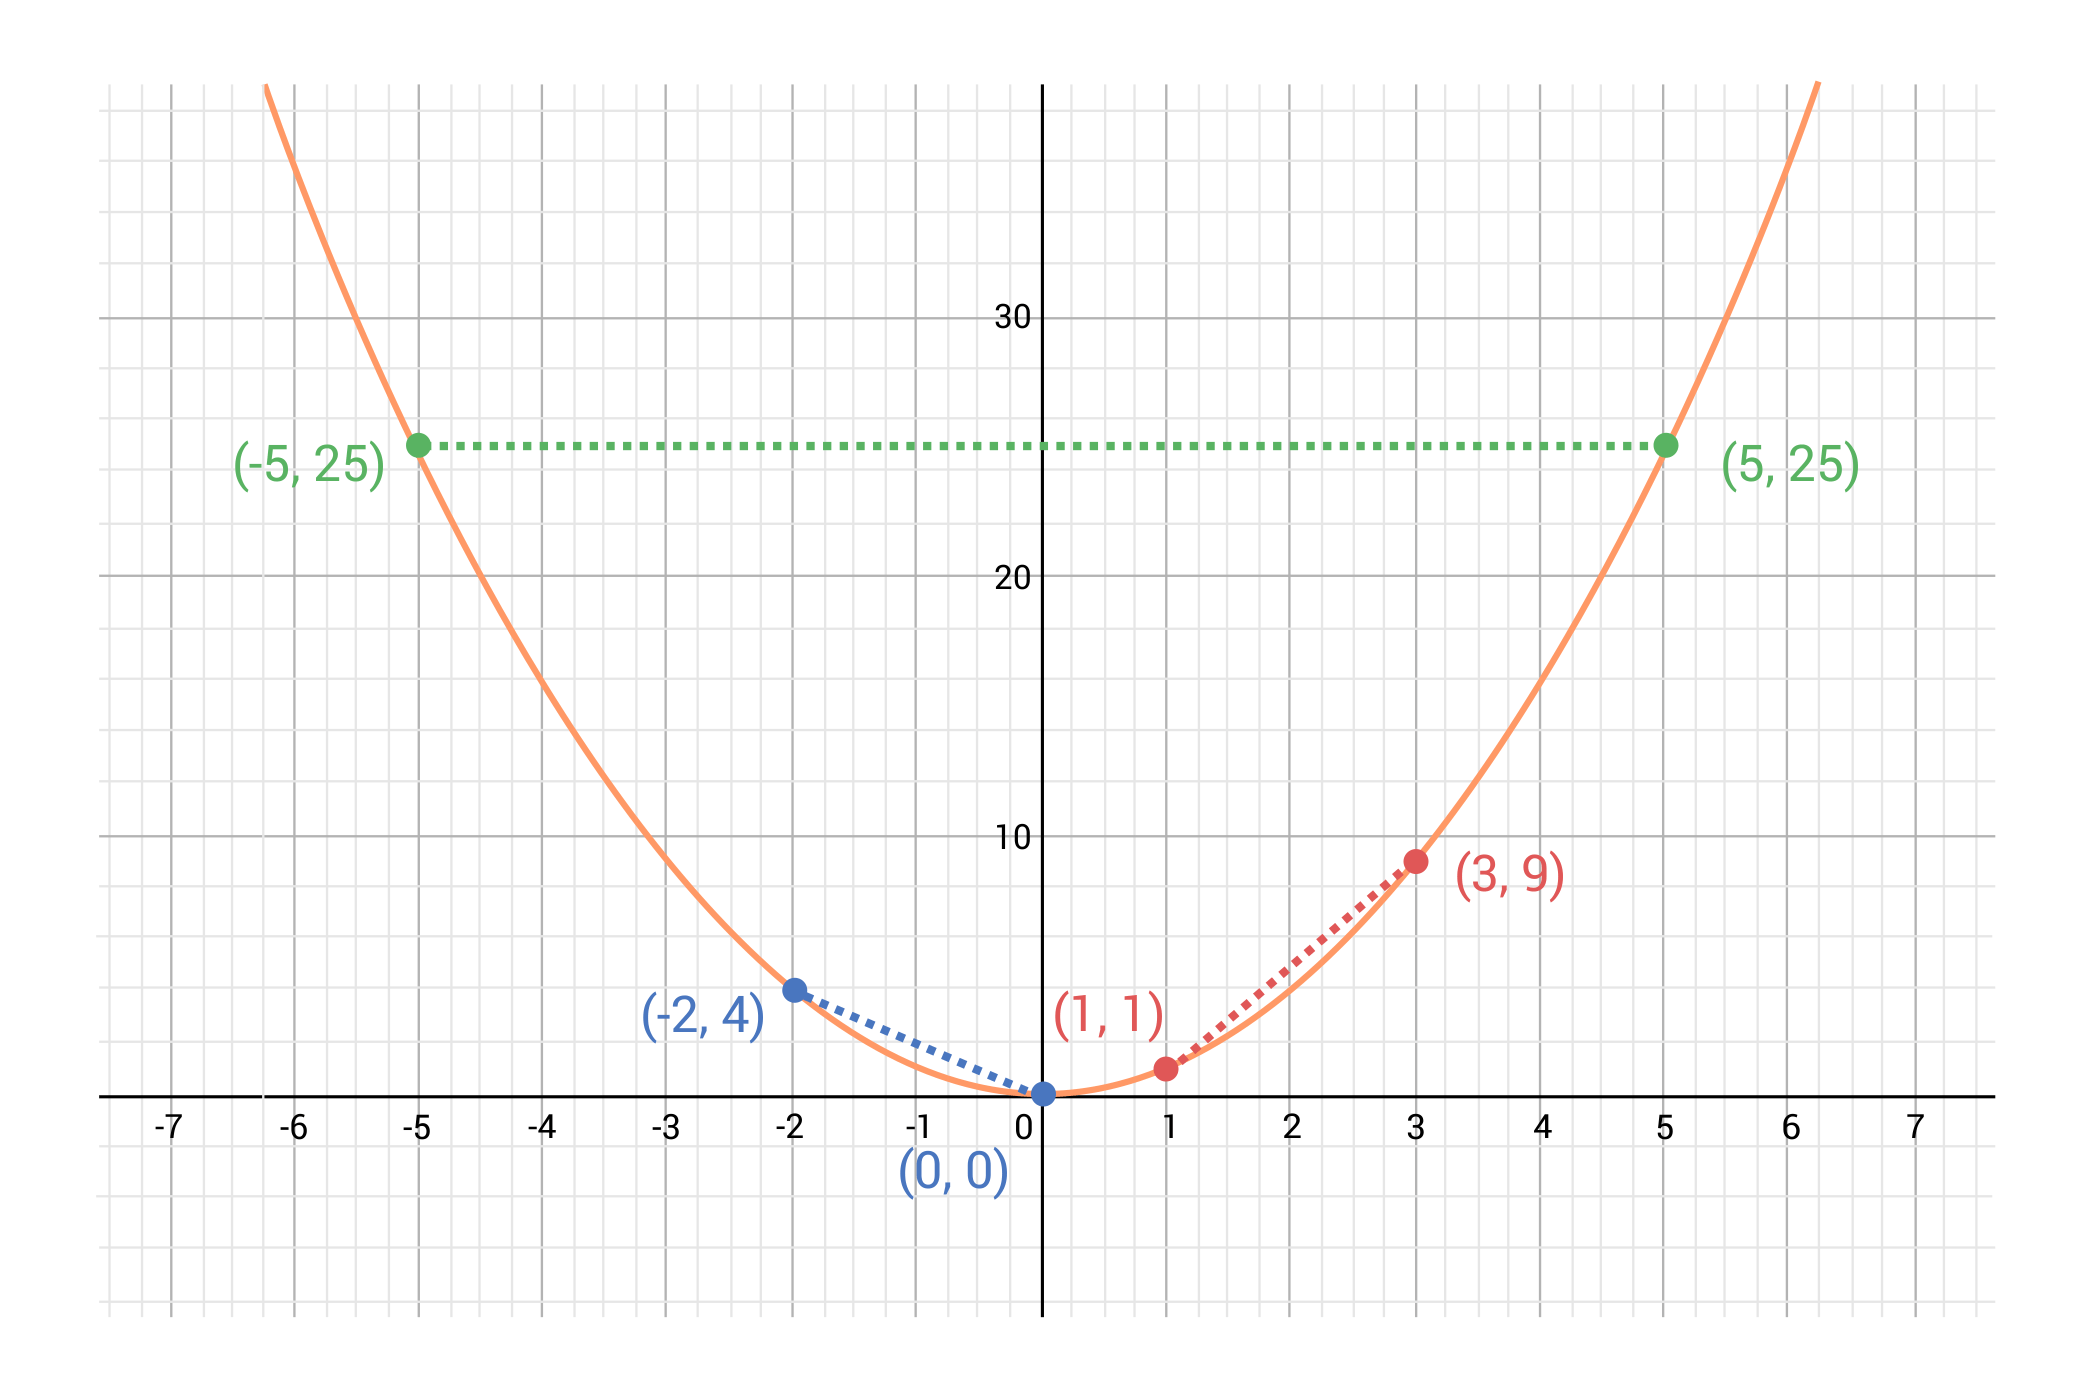
That triangle is the uppercase Greek letter Delta, which is used to denote change. Hence, when we read “\(∆x\)”, we say either “delta \(x\)” or “change in \(x\).” Let’s look at another example. This time, consider the function \(f(x)=x^2\), and compute the rates of change on the following three intervals:
- From \(x=-2\) to \(x=0\)
- From \(x=1\) to \(x=3\)
- From \(x=-5\) to \(x=5\)
First, the rate of change from \(x=-2\) to \(x=0\) can be computed as follows:
\(\frac{f(0)-f(-2)}{0-(-2)}=\frac{0^2-(-2)^2}{2}=\frac{0-4}{2}=-2\)
This means that from \(x=-2\) to \(x=0\), the function \(f(x)=x^2\) has a negative rate of change equal to -2. A negative rate of change means that a function is generally decreasing on that interval. What about from \(x=1\) to \(x=3\)?
\(\frac{f(3)-f(1)}{3-1}=\frac{3^2-1^2}{2}=\frac{9-1}{2}=4\)
The rate of change from \(x=1\) to \(x=3\) is positive, and equal to 4. This means that the function is growing on that interval. Finally, what’s going on from \(x=-5\) to \(x=5\)?
\(\frac{f(5)-f(-5)}{5-(-5)}=\frac{5^2-(-5)^2}{5+5}=\frac{25-25}{10}=0\)
We found an interval on which \(f(x)\) has a zero rate of change. In other words, from \(x=-5\) to \(x=5\), there is a net change in height of zero. Observe the graph below and note that we found positive, negative, and zero rates of change from the same function by checking different intervals.

Stock market prices continually bounce up and down. In an effort to predict the market, investors are interested in knowing how stocks behave in general over the course of a day, month, or year.
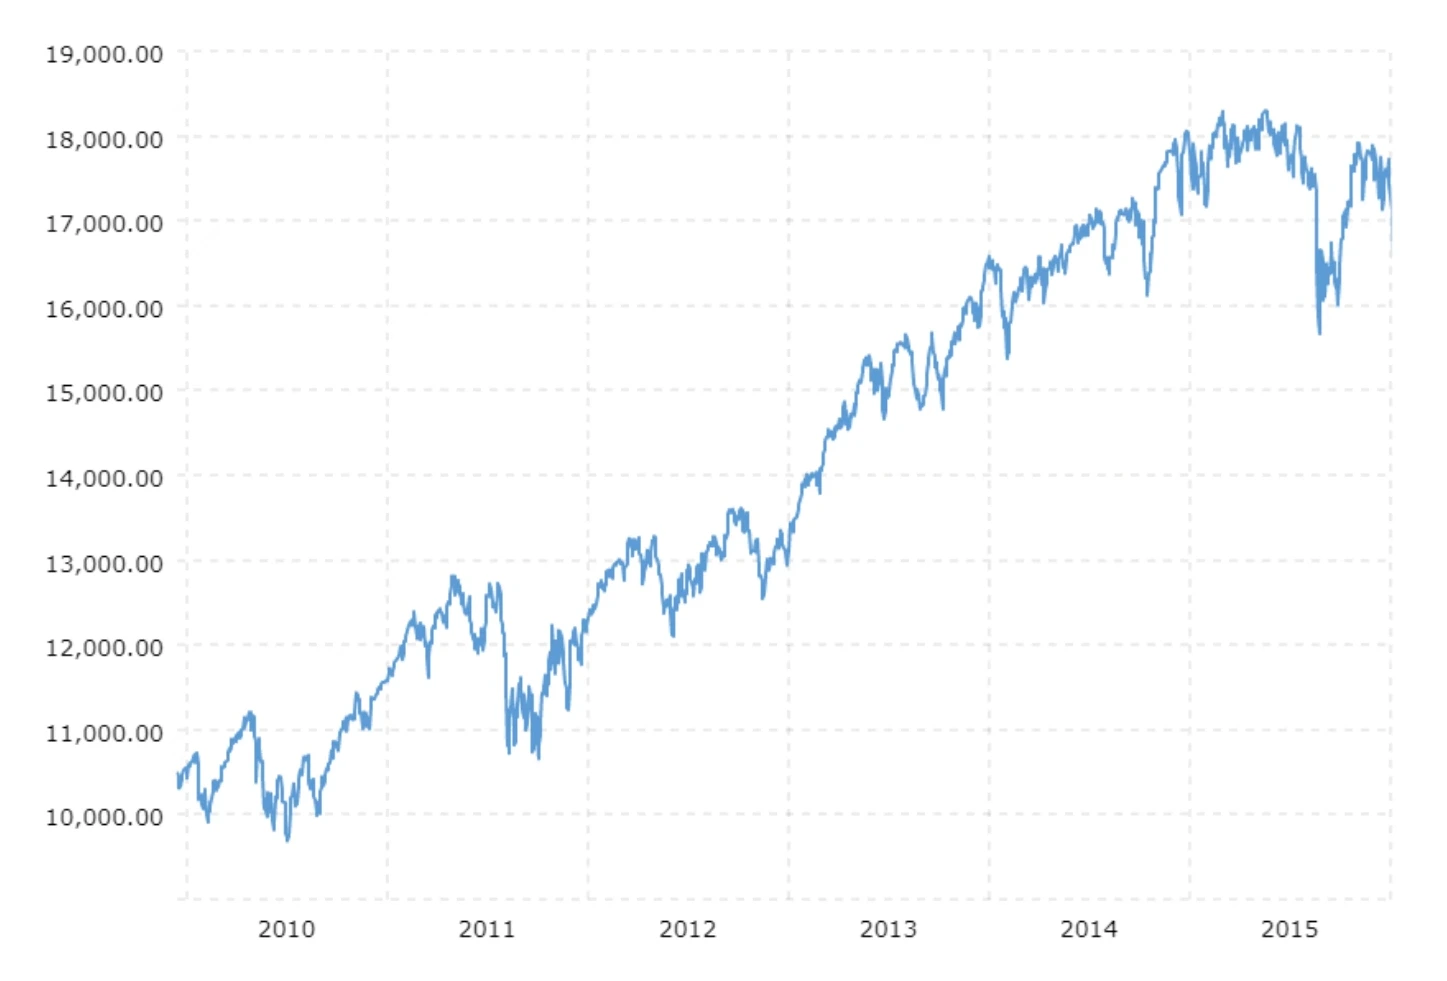
By observing a graph like this one, we can see that even though the stock price rose and fell many times over the period, in general the prices rose.
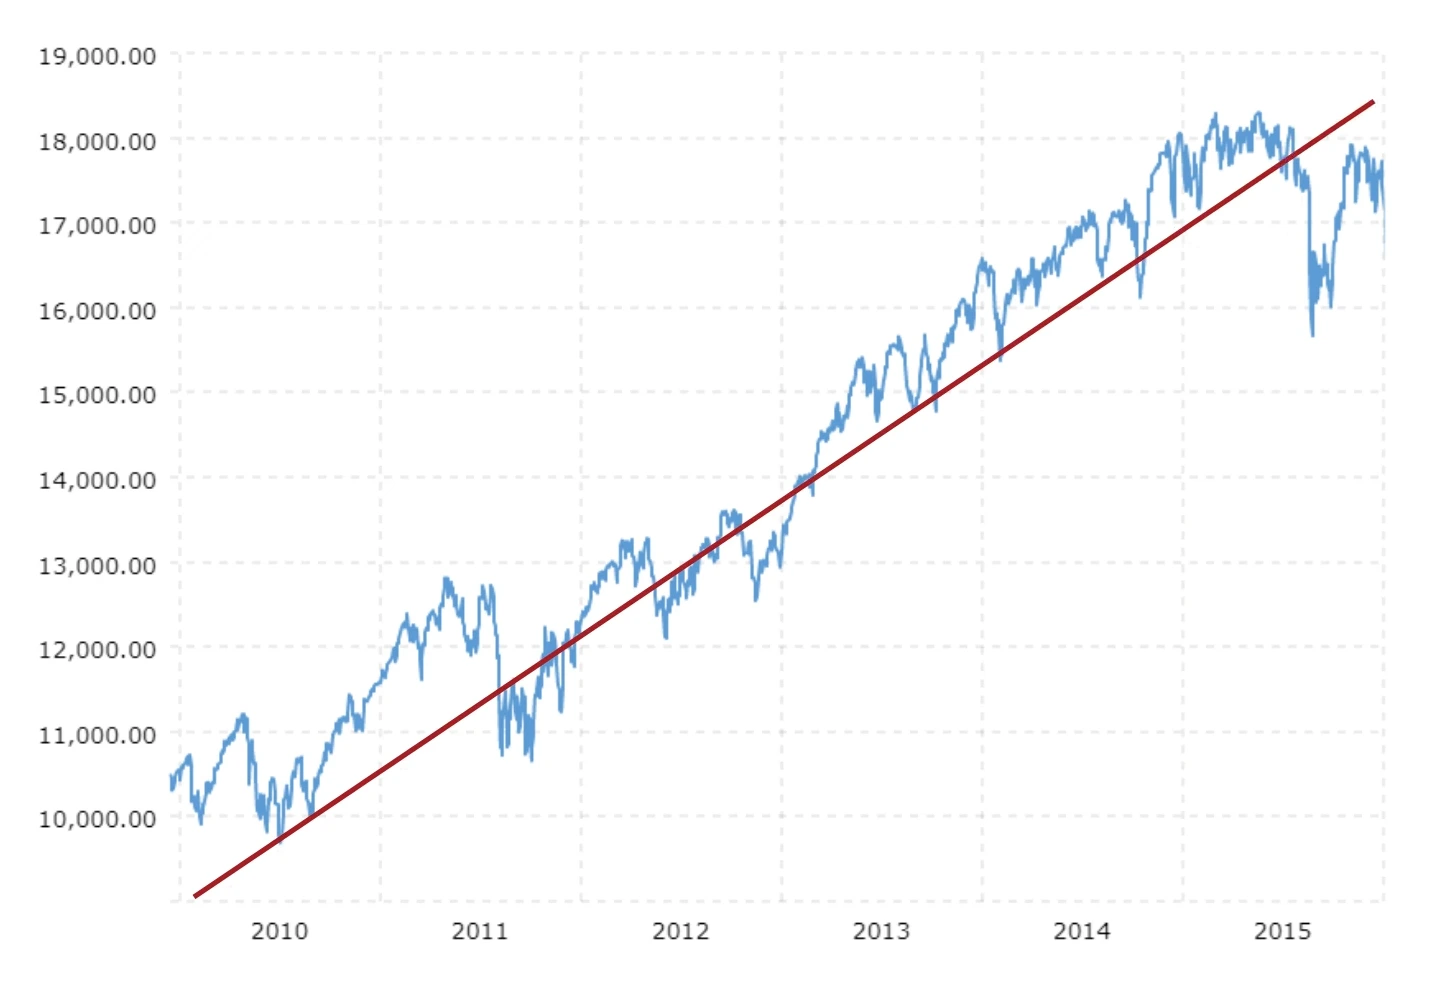
Determining the general behavior of a function over a specific interval or chunk of the graph is the big idea with average rates of change.
The average rate of change of a function over a particular interval is an approximation, or generalization, of the function’s slope over that interval. As we saw with the stock market graph, although this approximation did not communicate all the jagged edges of the function, it did well to describe the overall behavior of the function.
Average rates of change are calculated the same way slope is calculated.
We know that linear functions are straight lines whose equations can be written in the form \(y=mx+b\), where \(m\) is the slope of the function. One way to find \(m\) is by dividing the change in height of the function by the change in horizontal position. This is often called “rise over run.”
A shorthand way of saying “change in \(x\)” and “change in \(y\)” is with the uppercase Greek letter delta (\(\Delta\)), followed by \(x\) or \(y\). So if you see \(\Delta x\) or \(\Delta y\), know that these simply mean “change in \(x\)” and “change in \(y\),” respectively.
Example #1
Let’s now apply this idea to the stock market example.
Suppose we observe the points \((5,120)\) and \((7,150)\) lying on the price function, denoting that the stock cost $120 per share at month 5, and $150 per share at month 7.
We can find the average rate of change over this two-month period using \(\frac{\Delta y}{\Delta x}\). The change in \(y\) is equal to \(150-120\), which is 30. The change in \(x\) is \(7-5\), which is 2.
Putting these together, we see that the average rate of change in this stock price over the two-month period is equal to $15 per month. Notice this is a positive number, corresponding to the positive overall growth in the stock price.
The proper formula that we use for determining a function’s average rate of change over an interval is written slightly different from \(\frac{\Delta y}{\Delta x}\), but it is truly the same calculation. More formally, we write that the average rate of change is equal to:
Here, \(b\) and \(a\) are two \(x\)-values, \(f(b)\) and \(f(a)\) are the two corresponding \(y\)-values. So on the top, we have the difference in heights of two points (the rise) and on the bottom, we have the horizontal difference between those two points (the run).
Let’s try a couple examples to see this formula in action.
Example #2
Determine the average rate of change for the function \(f(x)=x^2+x\) from \(x=0\) to \(x=3\).
Here, we know that our two \(x\)-values of interest are 0 and 3. We are interested in knowing how the function behaves on the interval between those points. To determine that behavior, let’s use the average rate of change formula.
We know that the bottom is where the \(x\)-values go, and since 3 is larger than 0, we are going to choose to write 3 in place of \(b\), and 0 in place of \(a\).
For the top, we need to evaluate the function at 3 and 0 to determine the \(y\)-values there. Since we said that \(b=3\), we then have: that \(f(b)=f(3)\), which is \(3^2+(3)\), or 12.
Then, \(f(a)=f(0)\), which is \(0^2+0\), or just 0.
So on the top we have \(12-0\).
Altogether, we now have \(\frac{12}{3}\), or 4. So over the interval from \(x=0\) to \(x=3\), we know that the function grows at an average rate of positive 4.
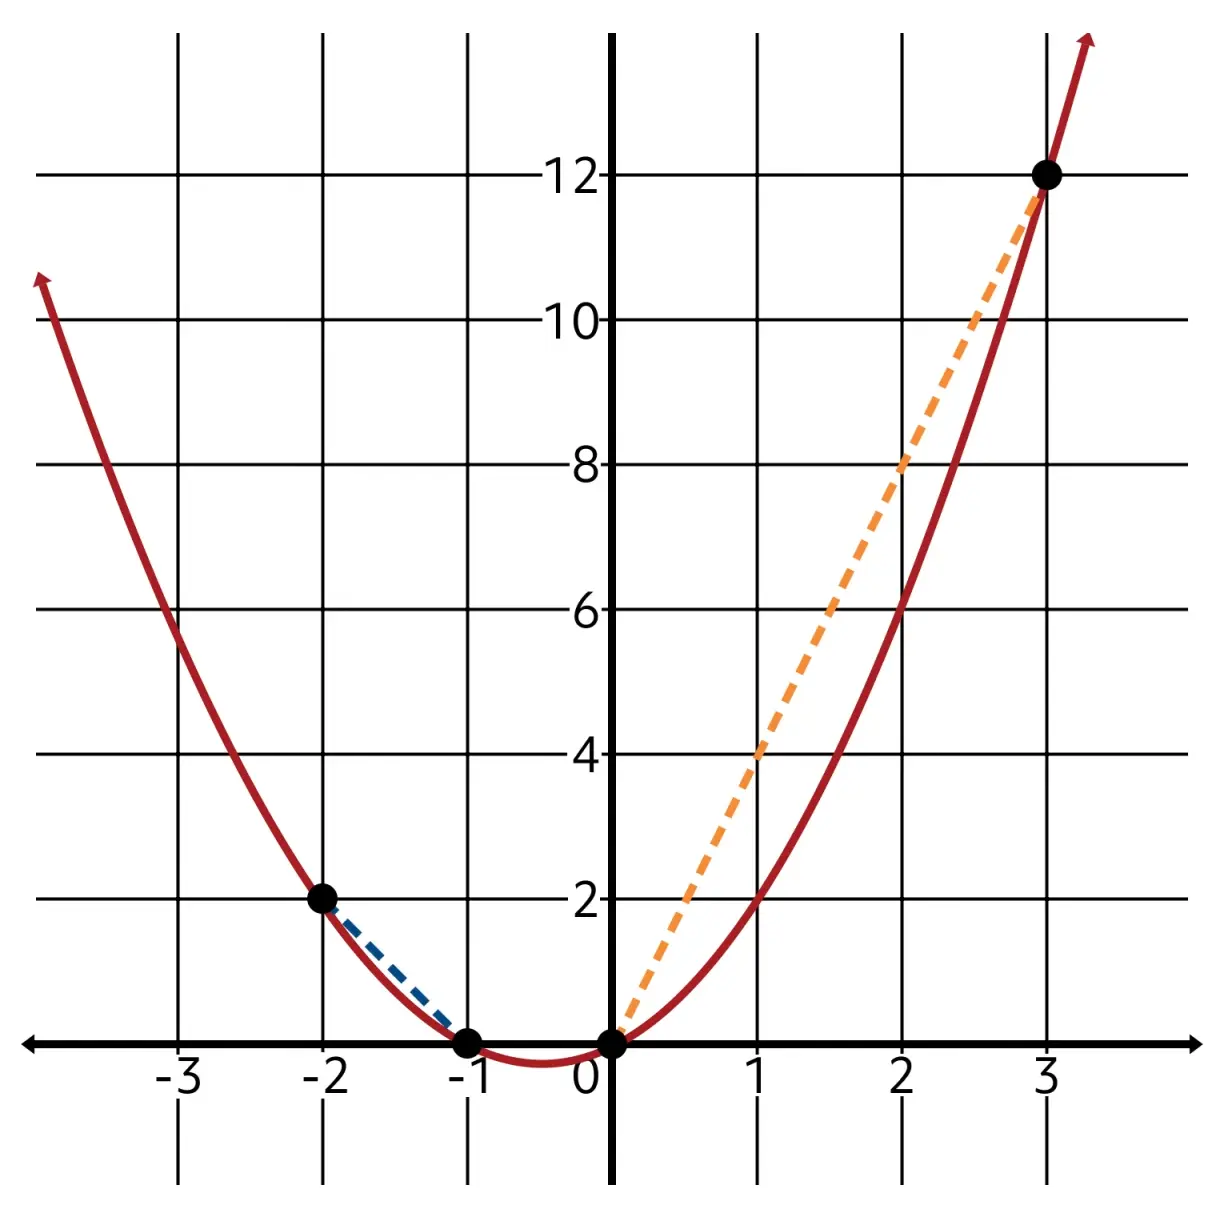
Let’s look at the graph of the given function \(f(x)=x^2+x\). On the graph, we can see this by connecting the points \((0,0)\) and \((3,12)\) with a straight line. The slope of that connecting line is 4!

It is interesting to note that the average rate of change for a function depends on what interval you select.
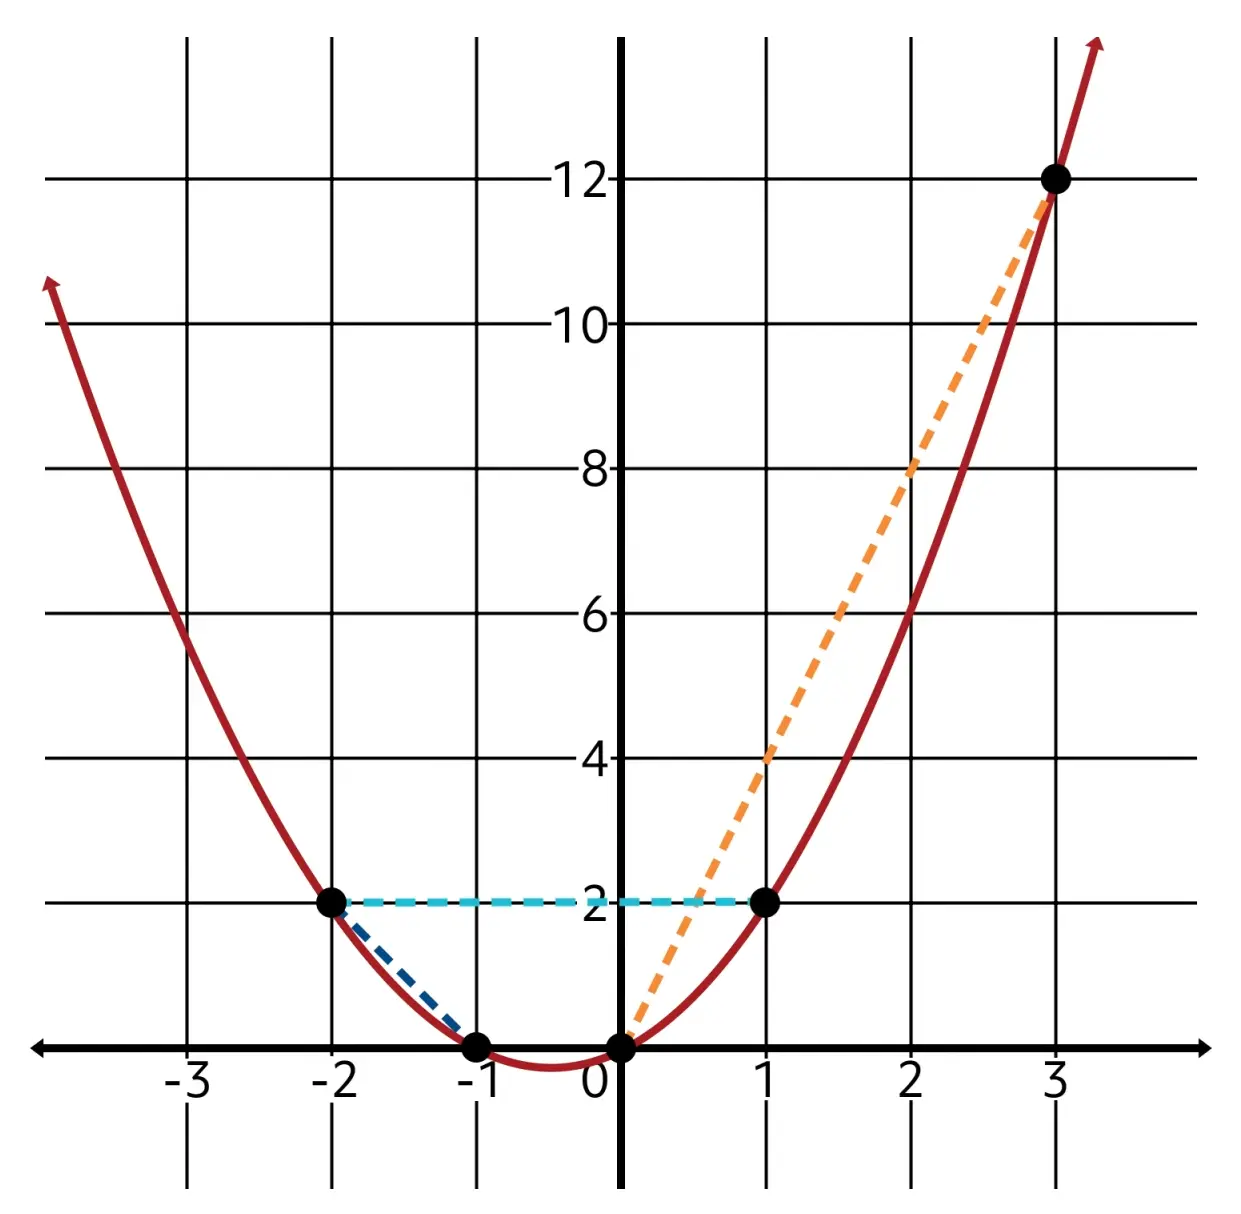
For example, in the function \(f(x)=x^2+x\), we just saw that the average rate of change from \(x=0\) to \(x=3\) was positive 4. But if we check the average rate of change over another interval, like –2 to –1, we get something else!
Using the formula, or by carefully observing the graph, we can determine that the rate of change over this interval is equal to –2!
At another interval, such as from \(x=-2\) to \(x=1\), we can see that the average rate of change is yet again different, and becomes zero!
You may find it unsurprising that such rates of change can be classified as positive, negative, and zero rates of change, respectively, based on their sign.
Example #3
Let’s work another example.
Find the average rate of change of the function \(f(x)=-x^2+5\) over the interval from \(x=-1\) to \(x=2\).
Let’s plug what we know into the rate of change formula.
In this example, our two \(x\)-values are –1 and 2. Since 2 is larger, choose it to be the \(b\)-value. On the bottom, we then have \(2-(-1)\).
On the top, we need to evaluate the function at 2 and at –1 to get \(f(2)\) and \(f(-1)\). First, \(f(2)\) gives us \(-2^2+5\), which is \(-4+5\), or 1.
Then, \(f(-1)\) gives us \(-(-1)^2+5\), which is \(-1+5\), or 4.
The numerator is then \(1-4\).
This simplifies to \(\frac{-3}{3}\), or –1. So the average rate of change of this function from \(x=-1\) to \(x=2\) is –1.
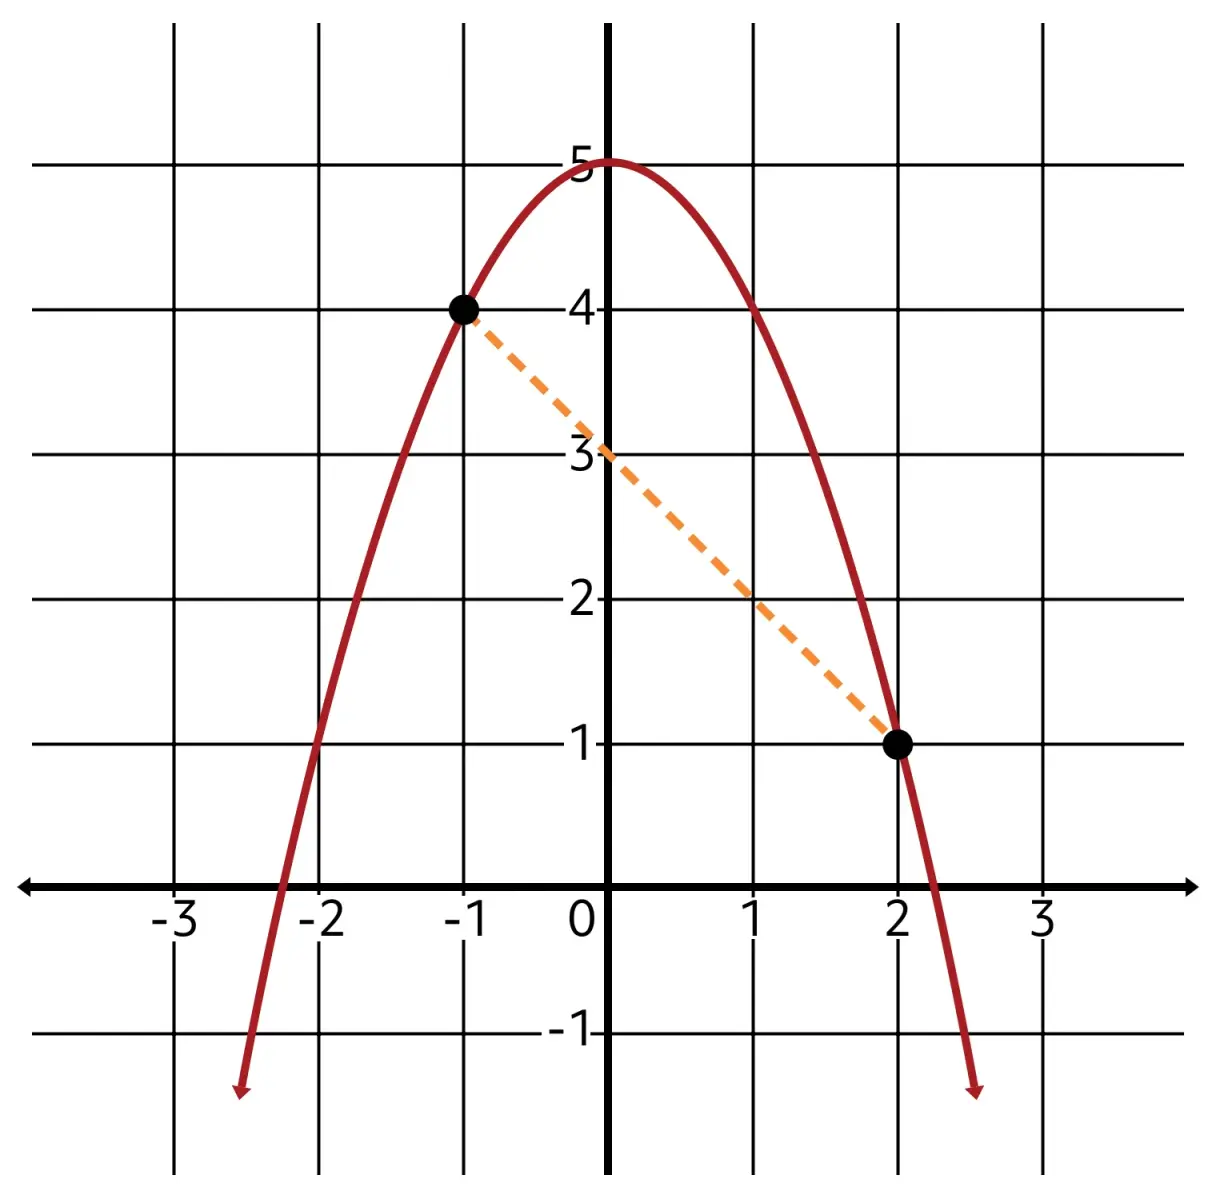
We can also deduce this answer by looking at the graph of \(-x^2+5\). If we mark the points at \(x=-1\) and \(x=2\), we can determine that their corresponding \(y\)-values are 4 and 1, respectively.
By plugging all of these values into the rate of change formula, or equivalently by calculating rise over run, we can again see that the connecting line between these points has a slope of −1.
Review
We now understand that the average rate of change for a function helps us determine how the function is generally behaving over some specified interval.
If the rate of change is positive, then the function overall tends upward for that interval. If the rate of change is negative, then the function tends downward. If the rate of change is zero, then the function has zero net change in height over that interval, although it could go up and down one or more times over the interval.
You can determine the average rate of change of a function using the formula \(\frac{f(b)-f(a)}{b-a}\) or by using the \(x\)– and \(y\)-coordinates of the points from the graph of the function in the rise over run formula \(\frac{\Delta y}{\Delta x}\).
Thanks for watching, and happy studying!
Practice Questions
Calculate the rate of change for the function \(f(x)=3x\) from \(x=2\) to \(x=6\).
The rate of change is 3. We can calculate this using the formula for rate of change:
\(\dfrac{f(6)-f(2)}{6-2}=\dfrac{3\times6-3\times2}{4}\)\(\:=\dfrac{18-6}{4}=\dfrac{12}{4}=3\)
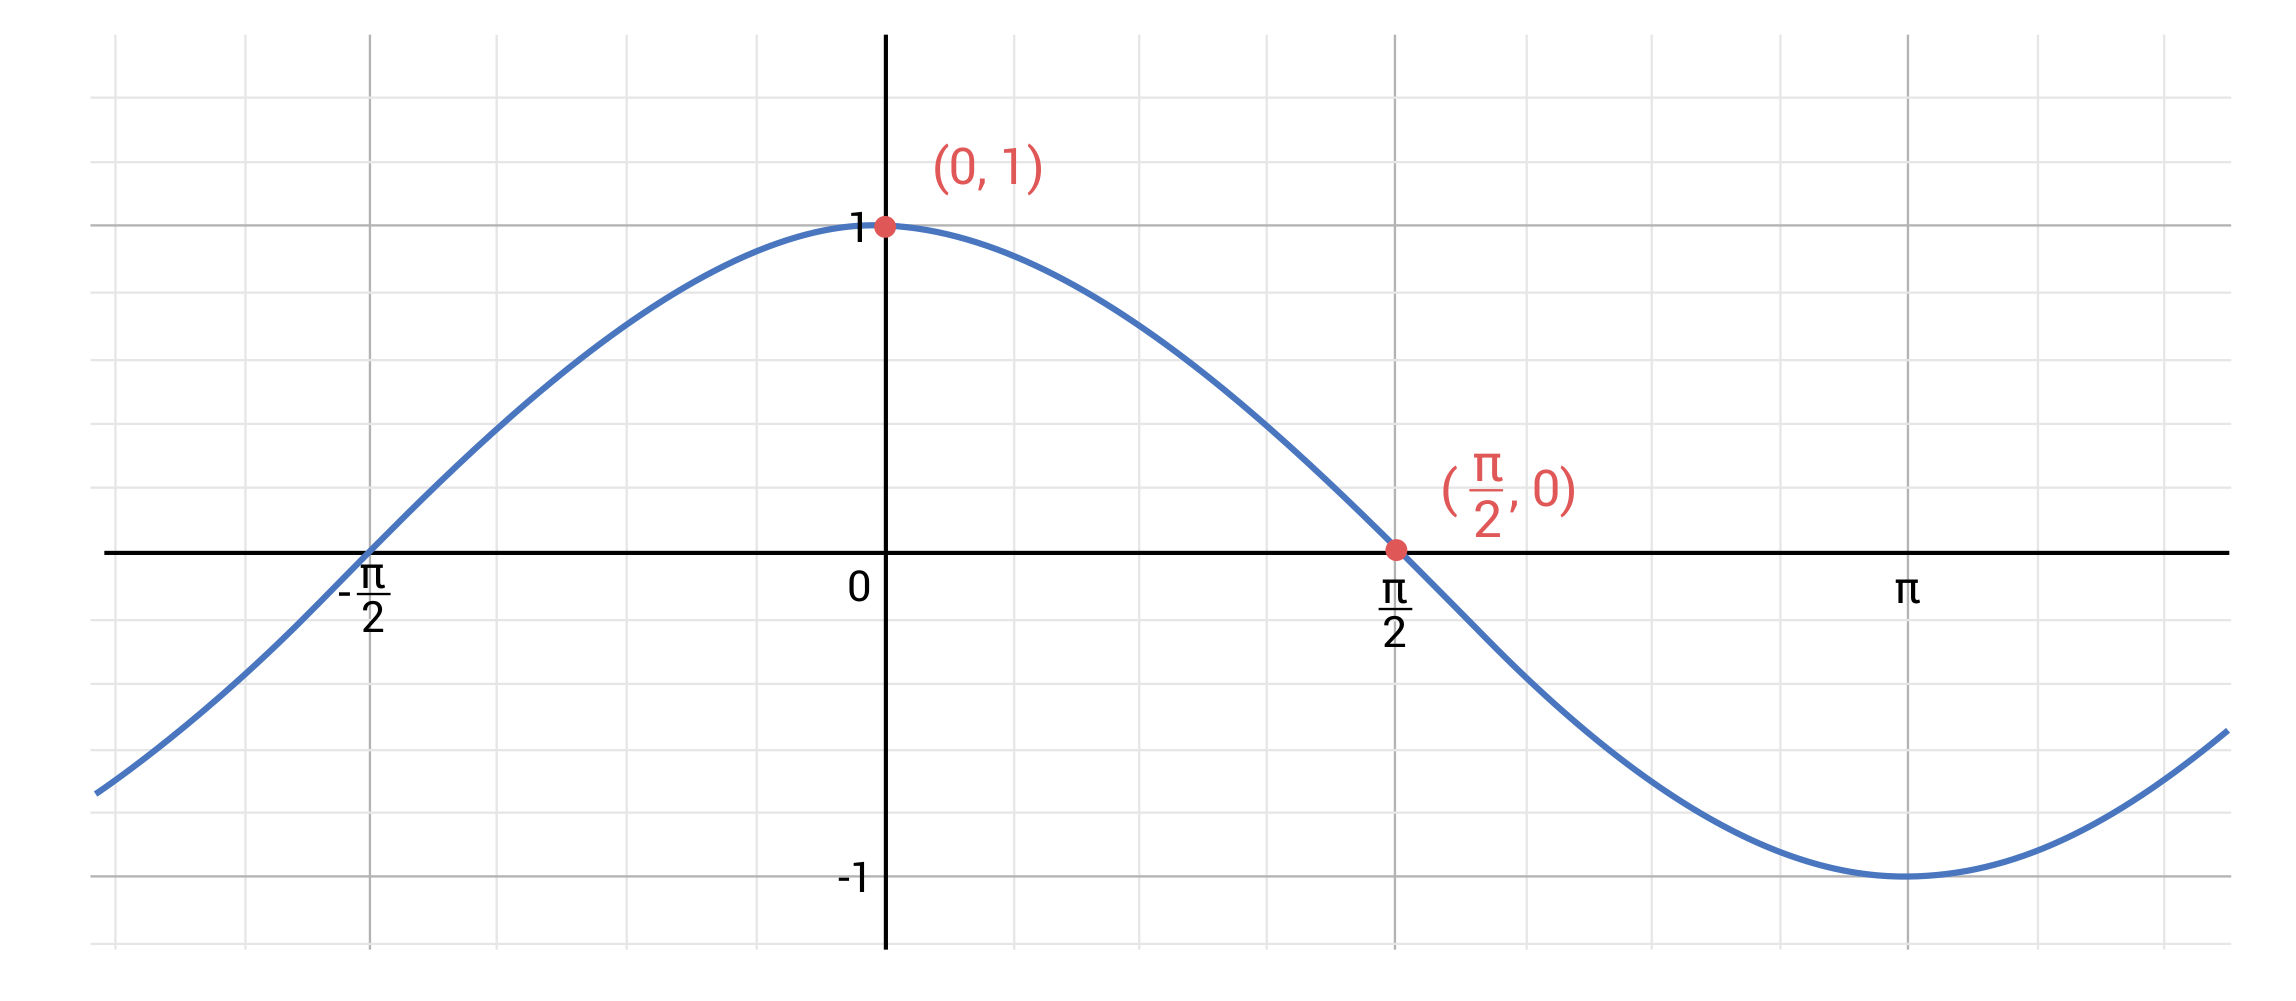
Is the rate of change for the function \(f(x)=\cos(x)\) positive, negative, or zero from \(x=0\) to \(x=2\)?
We can determine this by using the formula to calculate the rate of change, and then observing its sign, or by observing that the graph of \(\cos(x)\) is decreasing from \((0,1)\) to \((\frac{\pi}{2},0)\).
\(\dfrac{f(\frac{\pi}{2})-f(0)}{\frac{\pi}{2}-0}=\dfrac{\cos(\frac{\pi}{2})-\cos(0)}{\frac{\pi}{2}}\)\(\:=\dfrac{0-1}{\frac{\pi}{2}}=-\dfrac{2}{π}\)
Observe the graph given, and use \(\frac{\Delta y}{ \Delta x}\) to determine the rate of change from \(x=0\) to \(x=2\).
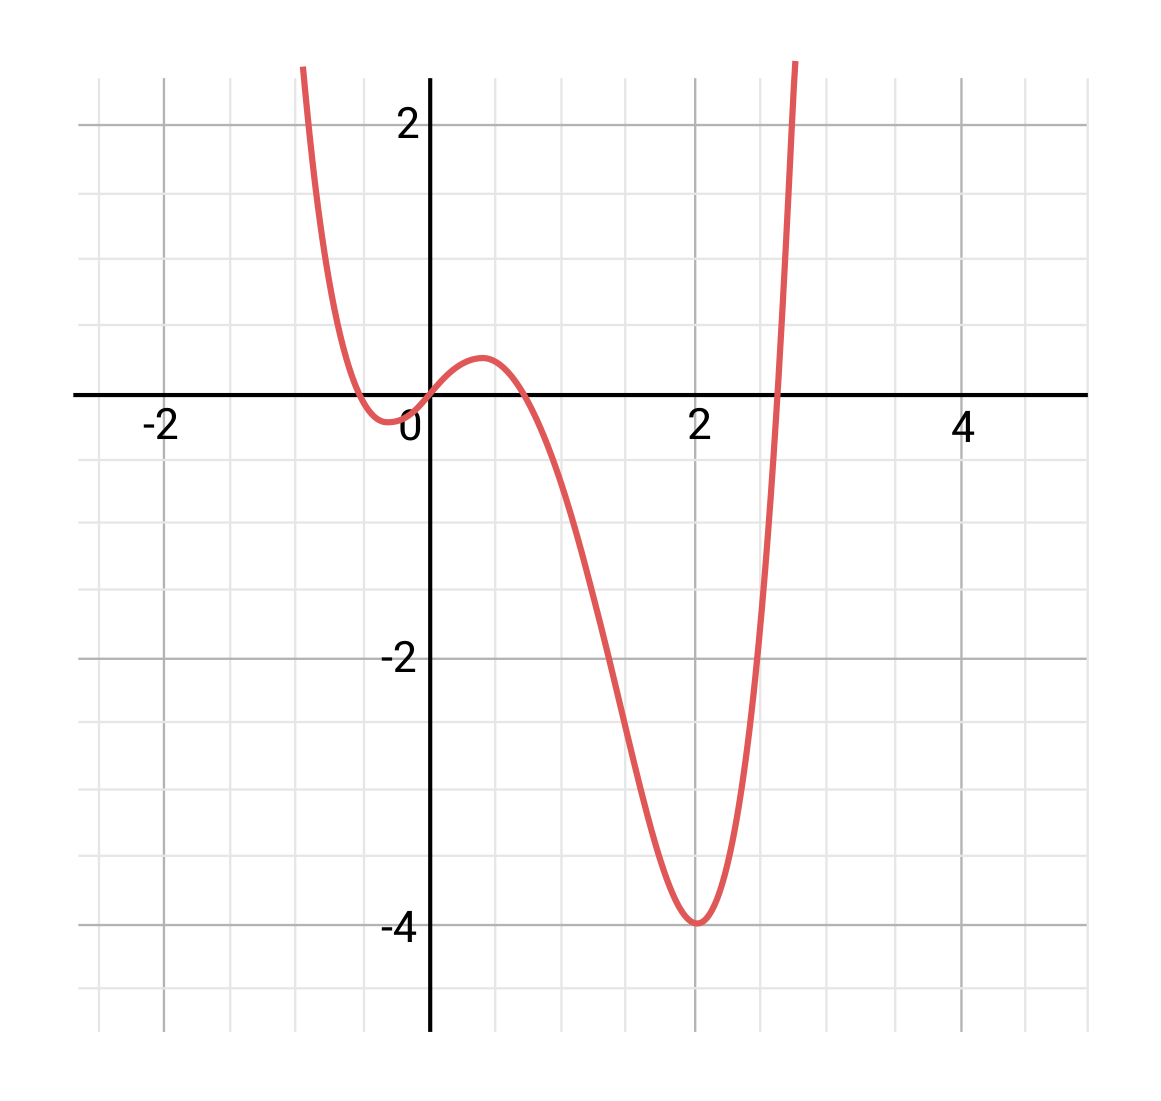
We can see visually that the function travels more downward than upward on the interval from 0 to 2, which indicates that the rate of change is negative. We can also plug in the points \((0,0)\) and \((2,-4)\) that we see on our graph into the formula to determine the magnitude of the rate of change.
\(\dfrac{\text{difference of}\:y \text{-values}}{\text{difference of}\:x \text{-values}}=\dfrac{\Delta y}{\Delta x}\)\(\:=\dfrac{-4-0}{2-0}=\dfrac{-4}{2}=-2\)
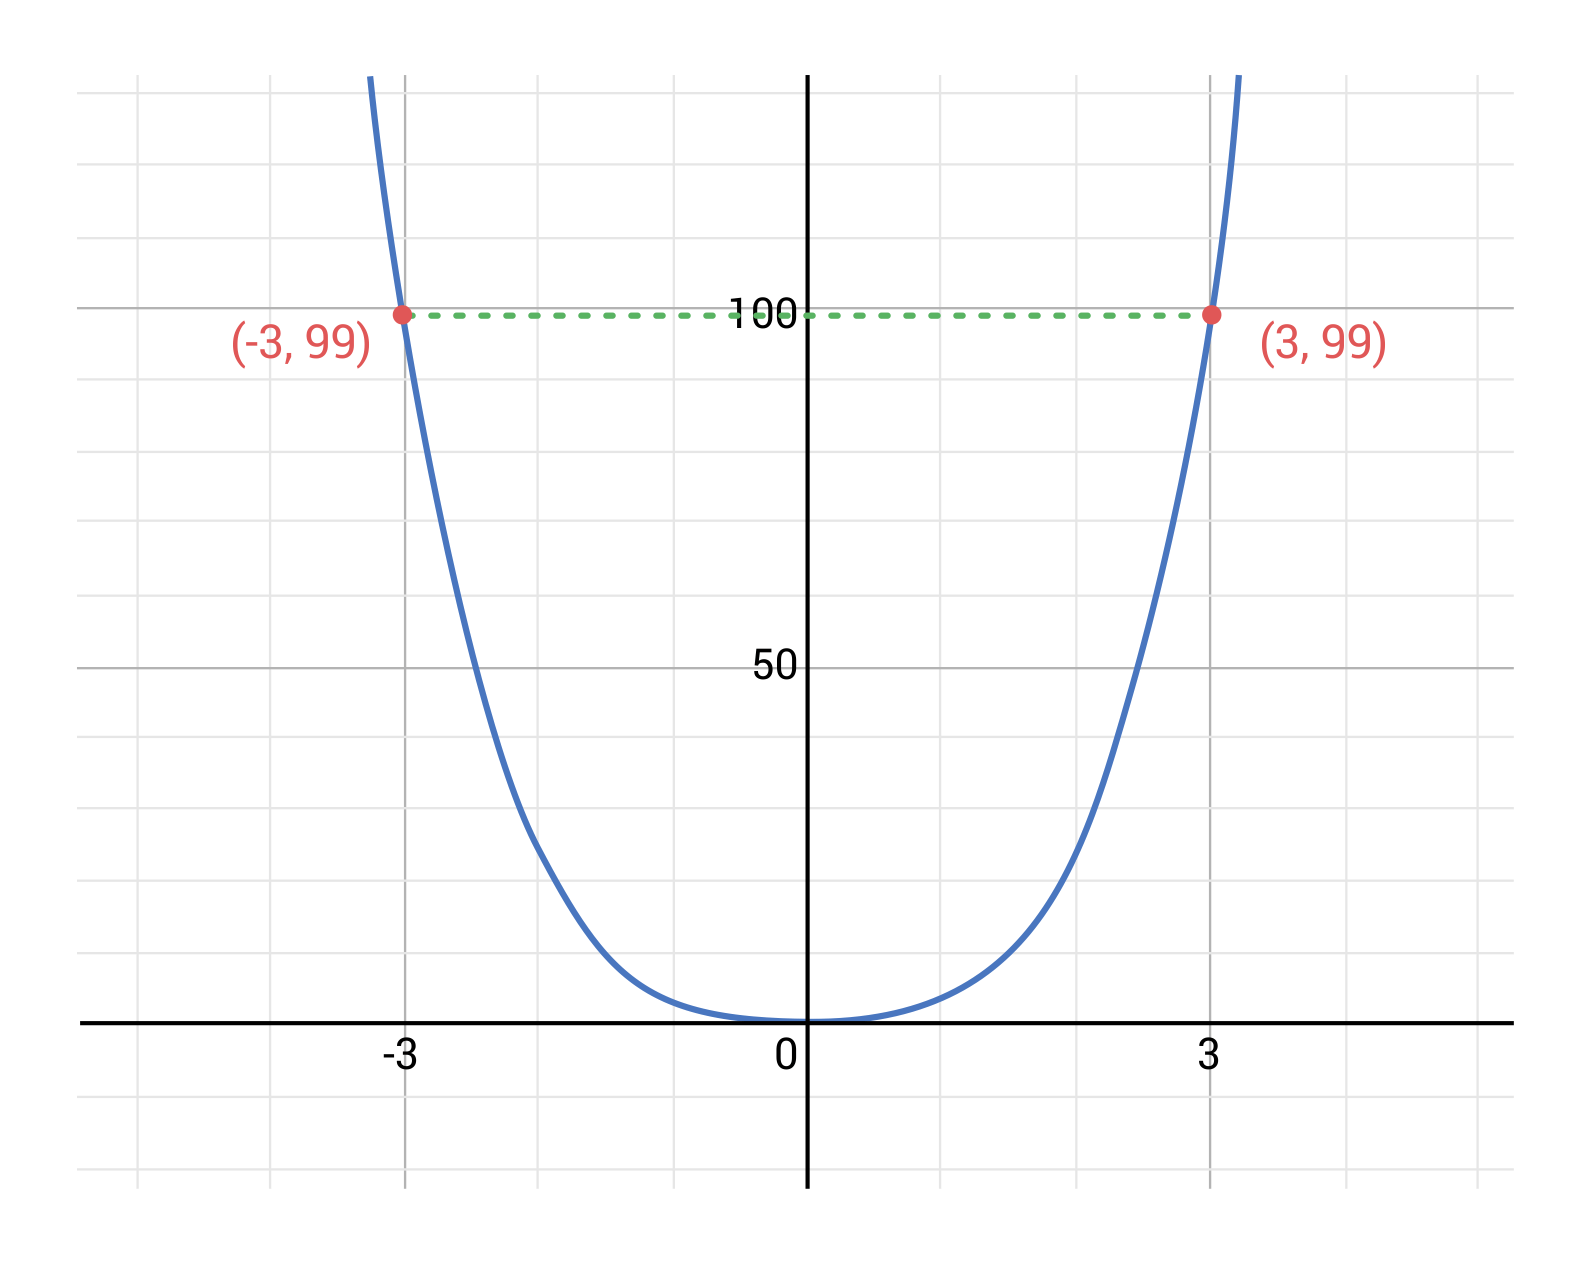
What is the rate of change for the function \(f(x)=x^4+2x^2\) from \(x=-3\) to \(x=3\)?
We can calculate the rate of change using the formula once again:
\(\dfrac{f(3)-f(-3)}{3-(-3)}\)\(\:=\dfrac{(3^4+2\times 3^2)-((-3)^4+2 \times (-3)^2)}{3+3}\)\(\:=\dfrac{81+18-81-18}{6}=0\)
This result can also be seen if we graph the function:
Milly’s Restaurant is keeping track of how many customers they are serving at given times throughout the day. Today, they had 4 guests at 3 pm, then 5 guests at 4 pm, 18 guests at 5 pm, and 22 guests at 6 pm. What is the average rate of change in number of customers from 3 pm to 6 pm?
This means that on average, six more customers were present with each passing hour. We can see this by using the formula:
\(\dfrac{f(6)-f(3)}{6-3}=\dfrac{22-4}{6-3}=\dfrac{18}{3}=6\)