
What is an Inequality?
An inequality is a mathematical expression where the two sides are not equal.
There are 4 inequality symbols:
| \(\gt\) | Greater than |
| \(\lt\) | Less than |
| \(\geq\) | Greater than or equal to |
| \(\leq\) | Less than or equal to |
We read the inequality, \(y≤2x+6\), as “\(y\) is less than or equal to six more than two times \(x\)”.
Graphing with Two Variables
To graph a linear inequality with two variables, we use the same process as when graphing a linear equation plus a few extra steps. When graphing the line, we either make our line solid, which includes the values on the line as part of the solution set, or we use a dotted line, which does not include the values on the line as part of the solution set. Here is how we decide if the line should be solid or dotted:
| \(\gt\) | Dotted line |
| \(\lt\) | Dotted line |
| \(\geq\) | Solid line |
| \(\leq\) | Solid line |
The last step in the process is to decide which side of the line to shade. One method is to pick one point on each side of the line, substitute into the equation, and simplify. Whichever results in a true statement will be the side that is shaded.
Another method is to shade below the line if the inequality symbol is \(\lt\) (less than) or \(\leq\) (less than or equal to), and shade above the line if the inequality symbol is \(\gt\) (greater than) or \(\geq\) (greater than or equal to).
Example Problem
Graph the inequality \(y≤2x+6\).
Start by graphing the line as if it is an equation, \(y=2x+6\). Since it is already in slope-intercept form, we know that the \(y\)-intercept is \(6\) and the slope is \(2\). Since the inequality is \(\leq\), we will make the line solid.
 As a last step, we pick one point on each side of the line and plug it into the inequality. For ease, I am going to pick \((0,0)\), on the right side and \((-4,4)\) on the left side.
| \((0,0)\) | \((-4,4)\) |
| \(0\leq 2(0)+6\) | \(4\leq 2(-4)+6\) |
| \(0\leq 6\) True statement | \(4\leq -2\) False statement |
We will shade the side that gave us the true statement because this means that the ordered pair is part of the solution set of the inequality.

Hi, and welcome to this video about linear inequalities! Today, we’ll explore what linear inequalities are, and see how to express their solutions.
Understanding Linear Inequalities
You probably have some experience with linear equations. They can be written in point-slope form \(y-y_{1}=m(x-x_{1})\), slope-intercept form \((y=mx + b)\), or standard form \((Ax + By = C)\) and their graphs are straight lines.
For an example, let’s use the equation \(y=2x + 1\).
There are an infinite number of solutions to the equation. Solutions, in this case, are coordinate pairs that lie on the line—algebraically, they make the equation true. So \((0,1)\) is a solution because \(1 = 2(0) + 1\). \((-1,-1)\) is also a solution since \(-1 = 2(-1) + 1\).
On the other hand, \((3,2)\) is not a solution because \(2 ≠ 2(3) + 1\).
What if, instead of the equation \(y = 2x + 1\), we replaced the equals sign with \(\lt\) to get \(y > 2x + 1\)? Well, for starters, that would give us a linear inequality!
Linear inequalities are simply inequalities that involve linear equations.
Testing Points on a Linear Inequality
The solution set is still an infinite set of points, but let’s see where they lie. We’ll start by graphing the line \(y = 2x + 1\) as before.
Okay, now let’s make a quick table so we can test some points on this graph. We’re interested in points on each side of the line, as well as on the line.
Let’s test \((3,-1)\) first. We can see this is below the line, and if we plug these numbers into our inequality, we see that it does not work. Or, we would say it isn’t “true”.
Let’s test another point, \((2,1)\). This is also below the line, and plugging the values into our inequality tells us it is not true.
Let’s try some that are on the line. \((1,3)\) and \((0,1)\) are both points on the line, but plugging in those values still doesn’t work.
Now let’s try above the line. \((-3,3)\) is above the line, and if we plug those values into our inequality, we find that it is true: \(2(-3) + 1\). \((-1,0)\) is also above the line, and if we plug those values into our inequality, we find that it is true as well: \(2(-1) + 1\).
| Location | Point | True? |
|---|---|---|
| Below line | \((3,-1)\) | \(-1 \gt 2(3) + 1\)? No. |
| Below line | \((2,1)\) | \(1 \gt 2(2) + 1\)? No. |
| On line | \((1,3)\) | \(3 \gt 2(1) + 1\)? No. |
| On line | \((0,1)\) | \(1 \gt 2(0) + 1\)? No. |
| Above line | \((-3,3)\) | \(3 \gt 2(-3) + 1\)? Yes. |
| Above line | \((-1,0)\) | \(0 \gt 2(-1) + 1\)? Yes. |
We can test as many points as we’d like, but this tells us more than enough information. All the points in the solution set are above the line, not on it. To show that, we shade that entire half of the graph.
The reason all of the points in the solution set are above the line is because of our inequality symbol. Our solution is “greater than”, so it will be above the line. If we used \(\lt\), our solution would be below the line.
So, that’s really the whole concept of linear inequalities.
Steps to Solve and Graph Linear Inequalities
In practice, we’re talking about 3 key steps:
- Graph the line as normal.
- Test 1 or 2 points; \((0,0)\) is always the easiest. If it lies on the line, try something like \((1,1)\) or \((-1,1)\).
- Dash the line if needed. If the inequality contains a less than or greater than, use a dashed line. If it contains \(\leq\) or \(\geq\), keep it solid.
Let’s use these steps for the inequality \(3x + 6y ≤ -12\)!
Here’s the graph.
Let’s test \((0,0)\): \(3(0) + 6(0) ≤ -12\) is not true. Therefore, we shade in the direction that does not include \((0,0)\) and keep the line solid.
Before we go, let’s have a little practice!
Write the inequality represented by this graph. Pause the video if you need more time:
The correct answer is \(y ≥ 4x – 8\).
I hope this review was helpful! Thanks for watching, and happy studying!
Graphing Linear Inequalities Practice Questions
Which graph best represents the inequality \(y>-2x+4\)?


First, graph the line for \(y>-2x+4\) on the coordinate plane. Since the \(y\)-intercept (\(b\)) is 4, the line will intersect the \(y\)-axis at 4, or \((0,4)\). The slope (\(m\)) is -2 or \(-\frac{2}{1}\). Starting at \((0,4)\), use the slope to find another point on the line. Since slope is rise over run, move down two units and right one unit to the point \((1,2)\).
Next, draw a line to connect the points. Since the inequality sign is “greater than”, connect the ordered pairs with a dashed line. This indicates that points on this line are not possible solutions.
Then, substitute origin point \((0,0)\) into the inequality as a test point to determine which portion of the coordinate plane to shade:
\(y>-2x+4\)
\((0)>-2(0)+4\)
\(0>0+4\)
\(0>4\) ✘
Since 0 is not greater than 4, the point \((0,0)\) cannot be part of the solution set. That means the values below the graphed line are not solutions to the inequality. Instead, shade the area above the line. The finished graph has a dashed line with a shaded region above it. All possible solutions are points above the line graphed.
Which ordered pair shows a possible solution for the inequality \(y≤\frac{1}{2}x-5\)?
Substitute each point into the inequality as a test point to determine if it is part of the solution set.
\(y≤\frac{1}{2}x-5\)
\((-5)≤\frac{1}{2}(5)-5\)
\(-5≤2\frac{1}{2}-5\)
\(-5≤-2\frac{1}{2}\)✔
Since -5 is less than or equal to \(-2\frac{1}{2}\), the point \((5,-5)\) is part of the solution set. The ordered pairs for Choices B, C, and D are not correct because they do not yield true statements when substituted into the inequality. Therefore, A is the correct answer.
Which inequality statement matches the graph shown?
First, identify the \(y\)-intercept by looking at where the graph of the line crosses the \(y\)-axis. The \(y\)-intercept (\(b\)) is 2, or \((0,2)\). Since C has -2 as the \(y\)-intercept (\(b\)), we can eliminate this answer choice. Because the graph moves in a positive direction, the slope (\(m\)) is a positive number. Therefore, we can eliminate D as an answer choice, which has -3 for the slope (\(m\)). The inequality is graphed with a dashed line, which indicates that points on the line are not possible solutions. In other words, the inequality symbol must be either < or >. We can eliminate A because the inequality contains the symbol ≤, which is graphed as a solid line. Therefore, the correct answer is B.
Vanessa is at a used bookstore that sells pre-owned books and DVDs. DVDs cost $8 each, and books cost $5 each. Vanessa wants to buy as many books and DVDs as she can afford, but she can’t spend more than $35. Which inequality statement best represents this situation?
The inequality statement needs to show that the total amount of money Vanessa spends cannot exceed $35. In other words, Vanessa can spend less than $35 or exactly $35. The inequality sign that matches this scenario is “less than or equal to” (≤).
Matthew is at the movie theater with a group of friends. He plans to buy some bags of popcorn and sodas for the group. Each bag of popcorn costs $6, and each soda costs $4. Matthew has $40 to spend and writes the inequality \(6x+4y≤40\) to represent the situation. Which statement below is true?
Using \(x\) to represent bags of popcorn and \(y\) to represent sodas, substitute each set of values into the inequality as a test point. Doing so will determine if it is part of the solution set.
\(6x+4y≤40\)
\(6(4)+4(4)≤40\)
\(24+16≤40\)
\(40≤40\) ✔
Since 40 is less than or equal to 40, the set of values in Choice D are part of the solution set. The values given for Choices A, B, and C are not correct because they do not yield true statements when substituted into the inequality. Therefore, D is the correct answer.
Which shows the graph of the inequality \(y≤-\frac{2}{3}x+4\)?
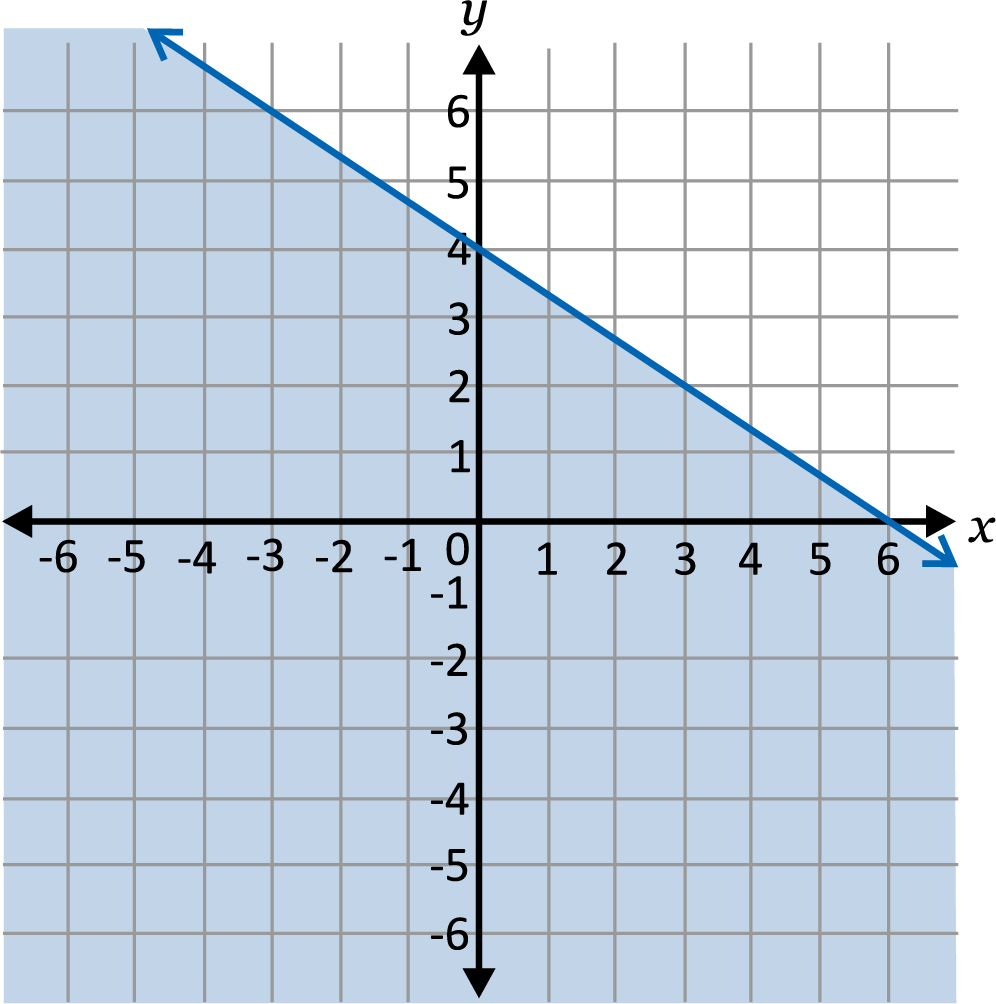
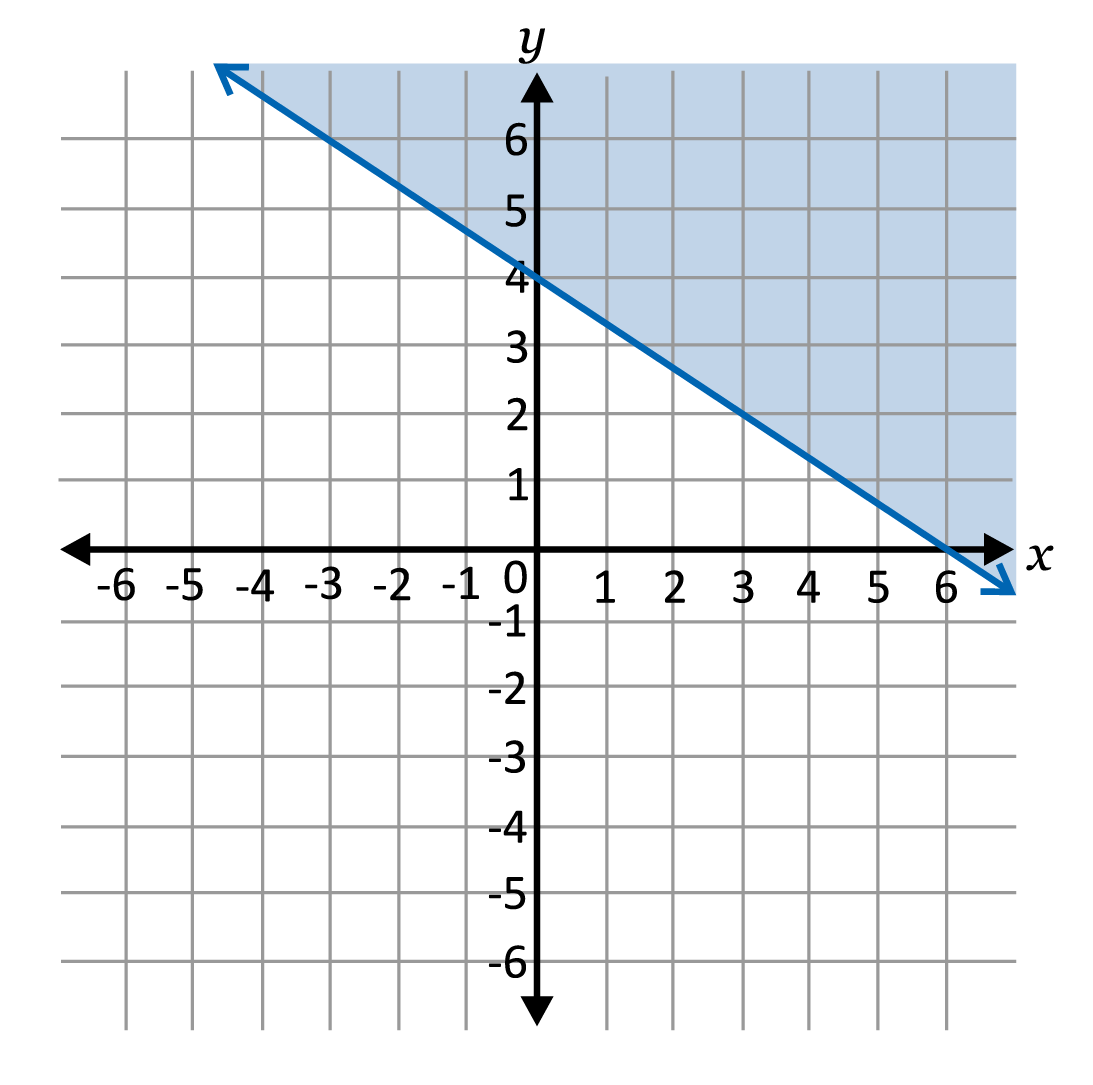
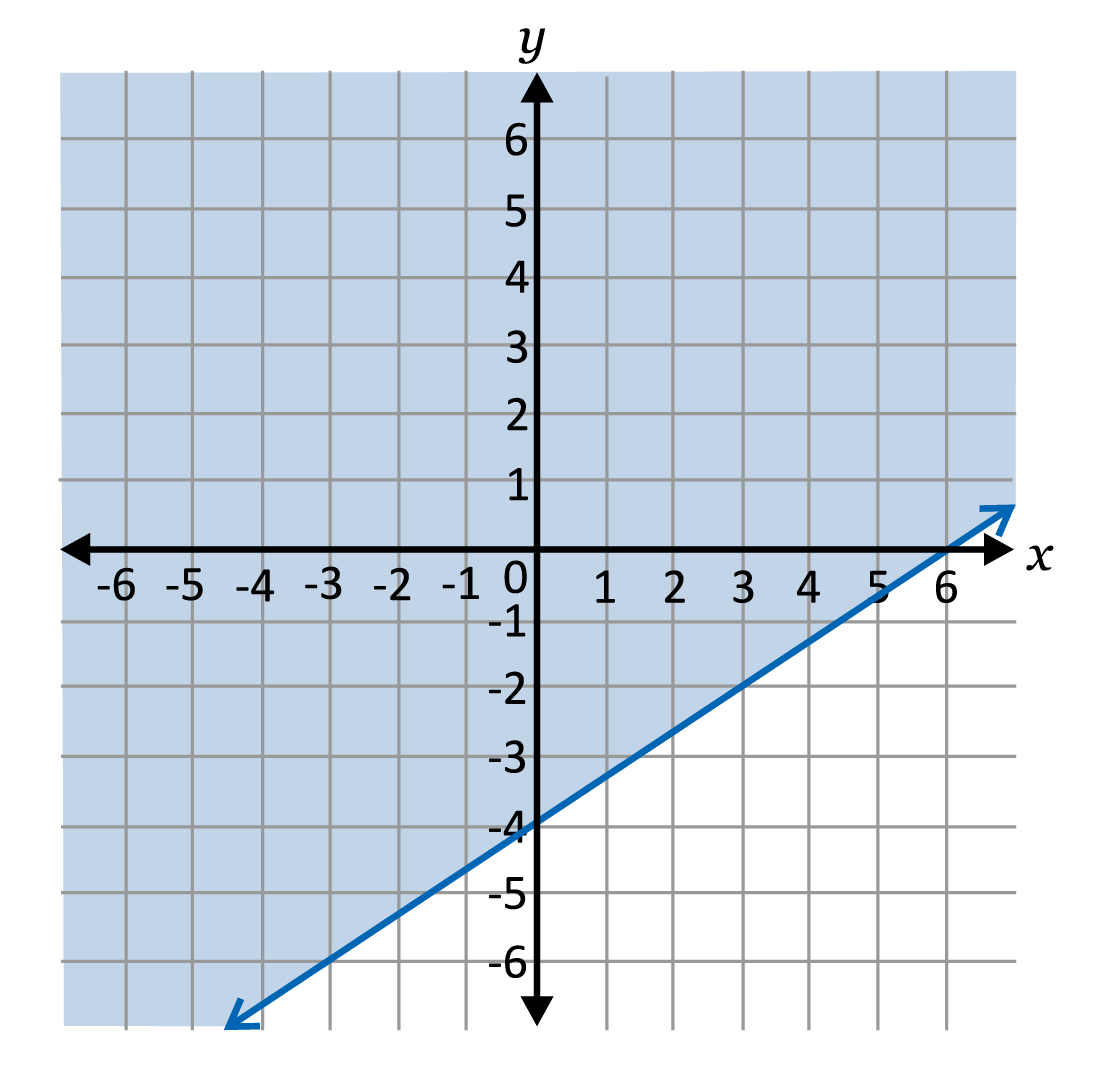
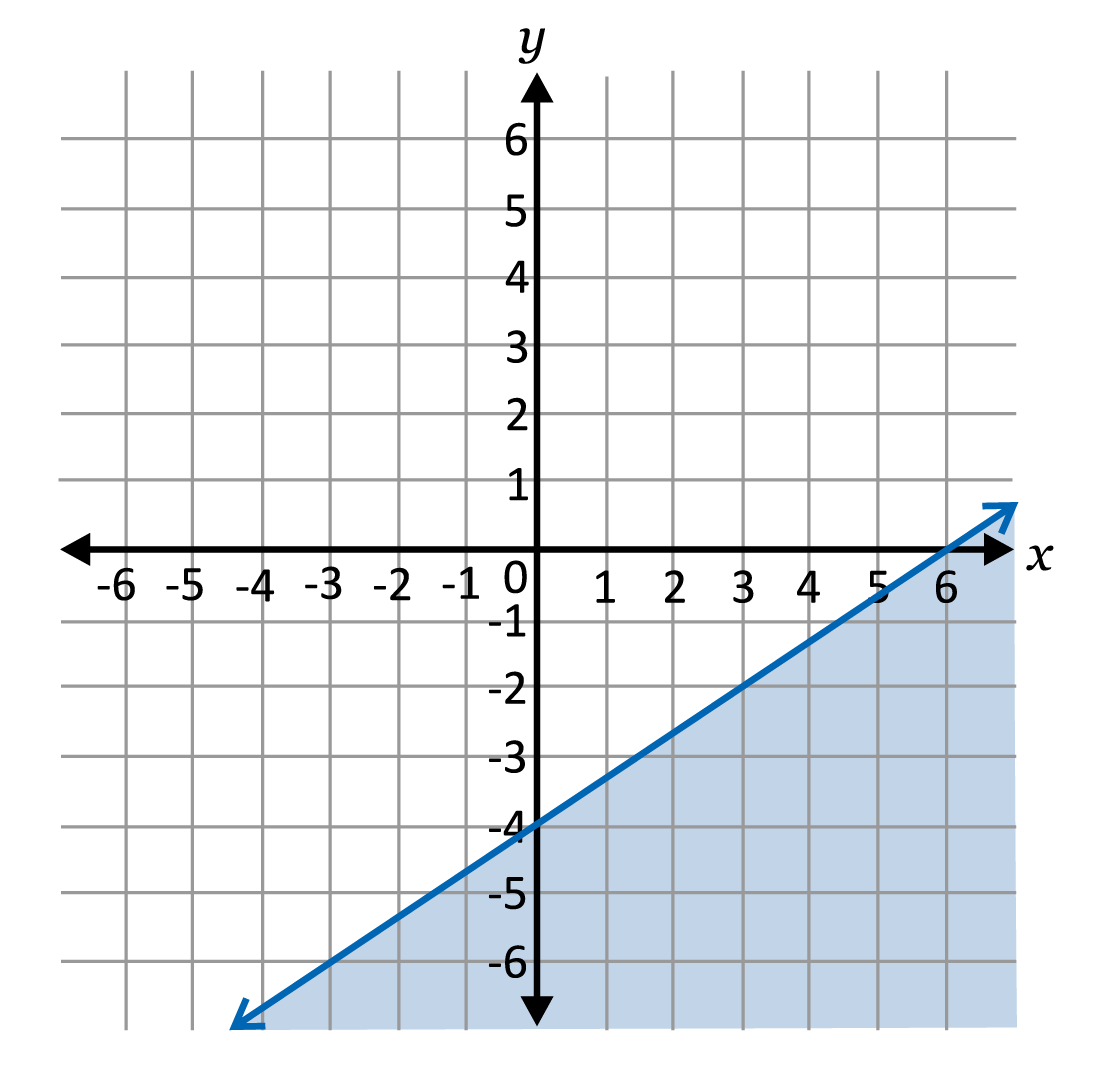
To graph an inequality, we start by graphing it as a linear equation. Since \(y≤-\frac{2}{3}x+4\) is in slope-intercept form, we know the \(y\)-intercept is \(4\) and the slope is \(-\frac{2}{3}\). Once the line is graphed, we will determine if the line should be solid or dotted. In this case since it is \(≤\) (less than or equal to), the line will be solid, which means the values on the line are part of the solution set for the inequality. The last step is to determine which side of the line should be shaded. One method is to pick a point one and use it to evaluate the inequality. If the point that results in a true statement, it will be on the side that is shaded. Start with \((0,0)\), \(0≤-\frac{2}{3}(0)+4\), after simplifying we are left with \(0≤4\), which is a true statement, so we will shade below the line.
Here is the graph of an inequality:
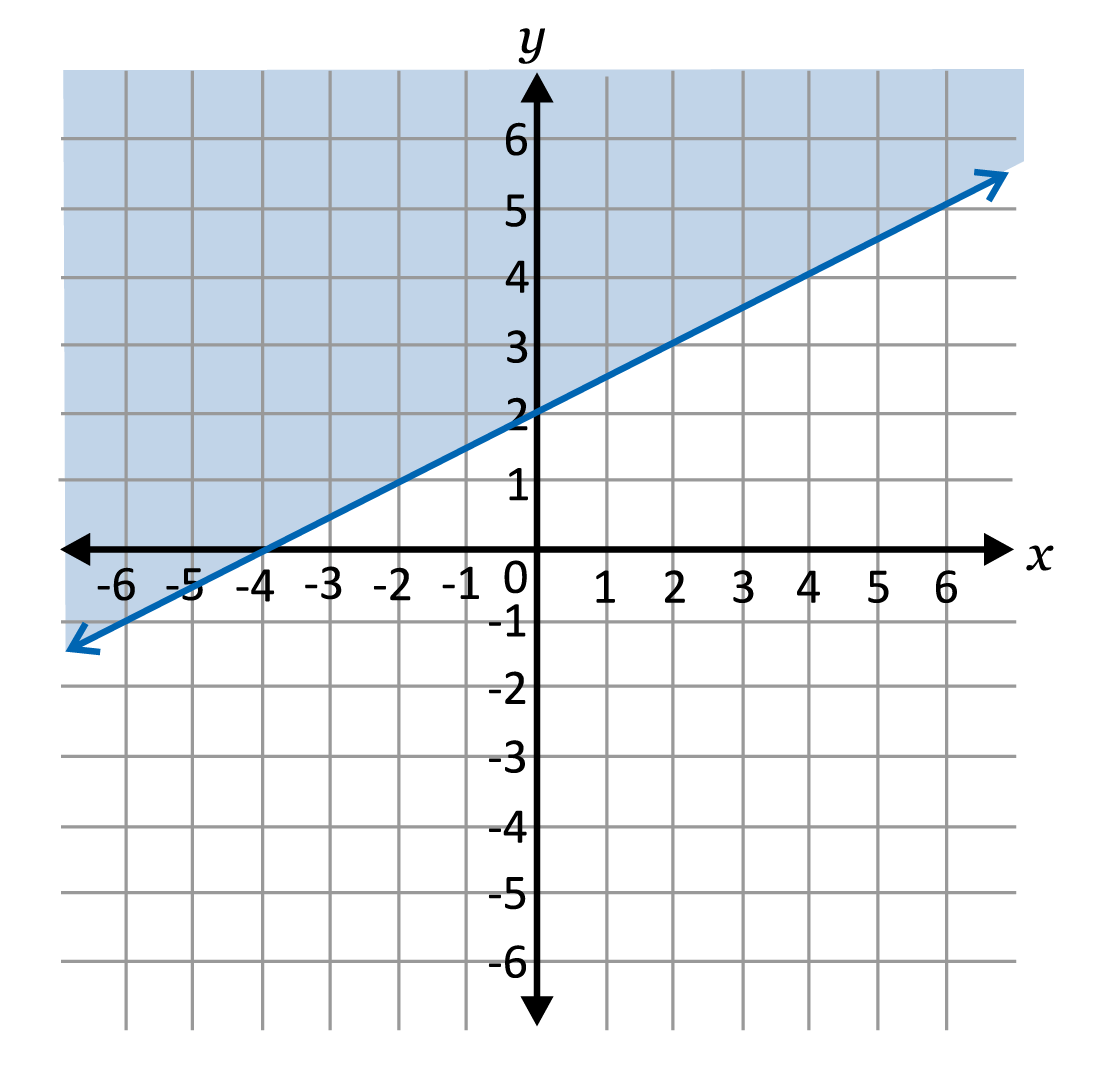
Which inequality is shown on the graph?
The graph of the line shows a line that is going through \((0,2)\) and slope of \(\frac{1}{2}\), since the top part of the graph is shaded, and the line is solid, the correct answer is \(y≥\frac{1}{2}x+2\).
The graph of an inequality is shown.
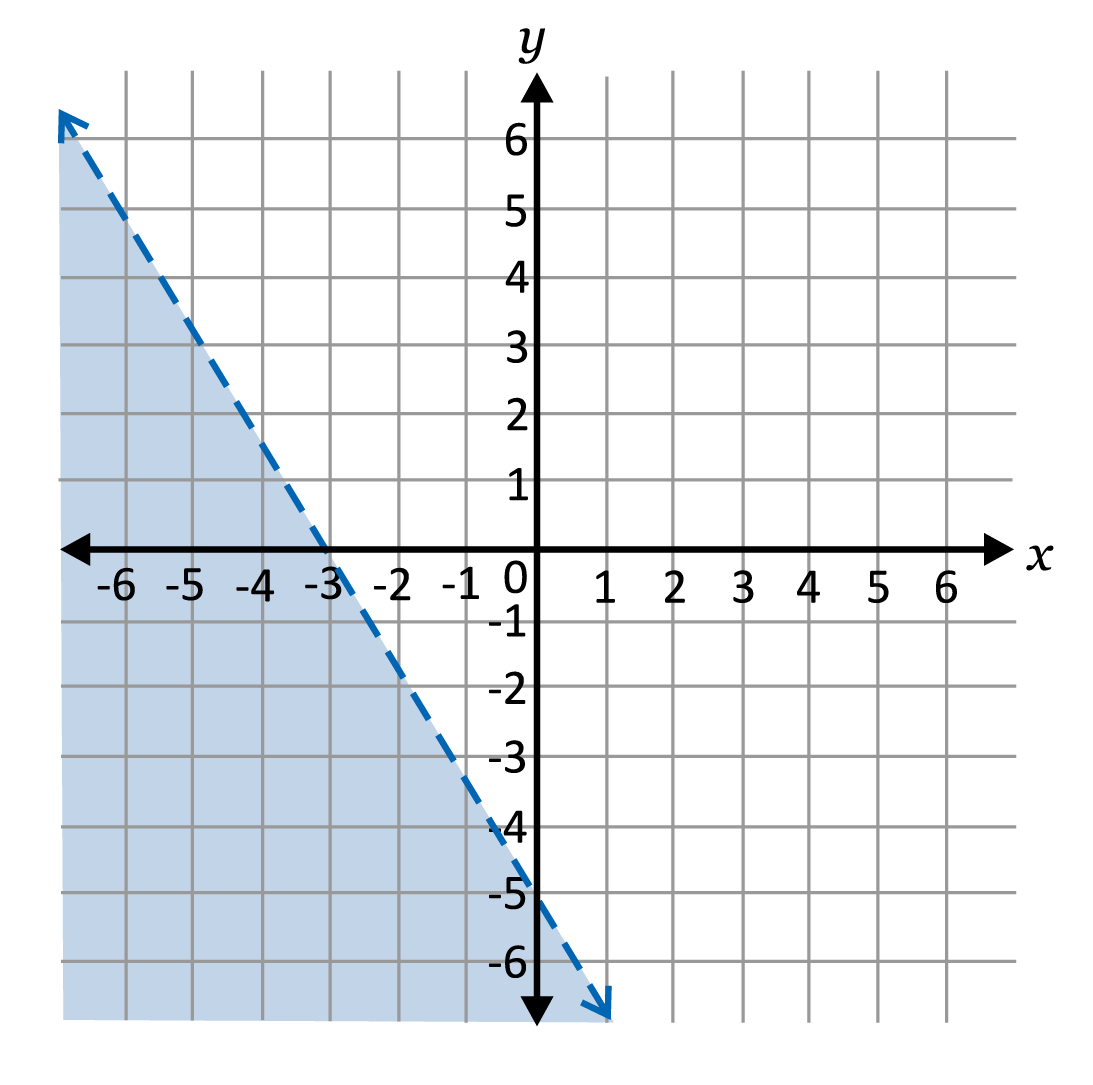
Which inequality is shown on the graph?
The dotted line, which tells us that the answer will either have a \(>\) or \(<\) inequality symbol, goes through \((0,-5)\), which is the \(y\)-intercept, and has a slope of \(-\frac{5}{3}\). Since the bottom half of the graph is shaded, we know the answer is \(y<-\frac{5}{3}x-5\).
The graph of an inequality has a dotted line, is shaded on top, has a slope of \(-2\) and goes through the point \((0,3)\). Which inequality has this graph?
Since all the inequalities have a slope of \(-2\) and their \(y\)-intercept is \((0,3)\), we will take a closer look at the inequality symbols. The inequality that would produce the graph described would have to have either a < or > symbol since it is a dotted line. The fact that the top part of the graph, above the line, is shaded tells us that it must be the > symbol. Therefore, correct answer is \(y>-2x+3\).
The graph of an inequality goes through the points \((0,-6)\) and \((3,0)\), it is a solid line and is shaded on the bottom half of the line. Which inequality has this graph?
When given two points, we can use the slope formula to find the slope of the line, which is the change in y over the change in \(x\): \(m=\frac{0-(-6)}{3-0}=2\). We are told that the graph of the line goes through the point \((0,-6)\), so this is the \(y\)-intercept. Given that the \(y\)-intercept is \(-6\), the slope is \(2\), and the line is solid with the bottom half shaded, the correct answer is \(y≤2x-6\).


