Graphing Solutions to Inequalities

Hello, and welcome to this video about graphing solutions to linear inequalities!
Today we’ll explore what a linear inequality is and learn how to graph simple and compound inequalities on a number line. We’ll also talk about how to graph inequalities involving absolute value and inequalities with more than one variable.
Before we get started, let’s review a few things. First, an inequality compares two values and shows whether they are less than, greater than, less than or equal to, or greater than or equal to each other.
- \(a>b\) means that \(a\) is greater than \(b\).
- \(a\lt b\) means that \(a\) is less than \(b\).
- \(a\geq b\) means that \(a\) is greater than or equal to \(b\).
- \(a\leq b\) means that \(a\) is less than or equal to \(b\).
For example, \(x\lt 15\) means that the value of \(x\) is less than 15. Likewise, \(x \geq 6\) means that the value of \(x\) is greater than or equal to 6.
Solutions are numbers we can replace the variables for in inequalities that make them true. For instance, one possible solution to \(x\lt 15\) is 5 because 5 is less than 15.
Solutions to inequalities are graphed on number lines and coordinate planes, depending on how many variables are in the inequality. These graphs help illustrate all possible solutions, or the solution set, for the inequality.
Let’s take a look at an example: \(x \lt 5\). If \(x\) is less than 5, then all possible solutions for \(x\) have to be numbers that are smaller than 5. We can illustrate this on a number line.
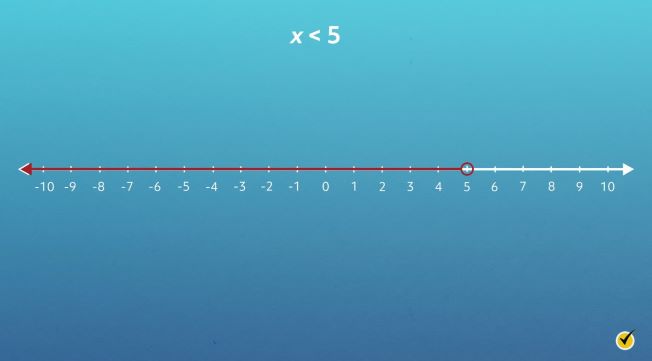
First, find 5 on the number line and draw an open circle above 5. We leave this circle open to indicate that 5 is not part of the solution set for this inequality. The value for \(x\) is less than 5, not equal to it.
Next, draw a line on the number line to indicate the possible solutions for \(x\). Since \(x\) is less than 5, we need to draw a line to the left of 5.
Notice that the line extends to the left of 5 with an arrow at the end. The arrow indicates that even though the number line ends at -10, there are an infinite number of solutions (numbers smaller than -10) that could make this inequality true.
Let’s try another one. Graph the solution set for the inequality \(x>-3\). If \(x\) is greater than -3, then all possible solutions for \(x\) have to be numbers that are greater than -3.
Pause the video here, draw a number line, and see if you can graph this one yourself. I know you can do it!
Let’s take a look at the number line together.
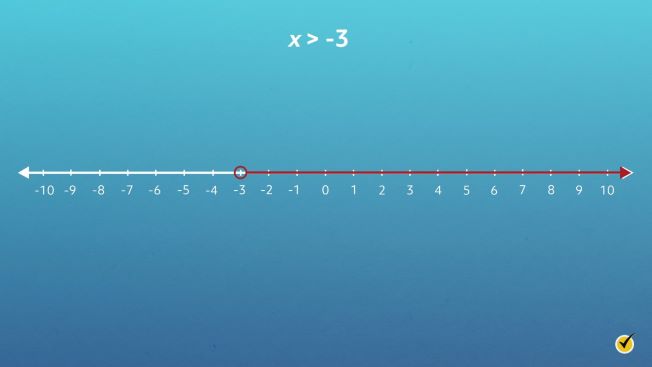
Notice that there is an open circle directly above -3 on the number line. Remember, this means that -3 is not part of the solution set because \(x\neq -3\). From -3, there is a line extending to the right with an arrow at the end. This line shows that the possible solutions for \(x\) are all numbers greater than -3. Great job!
Here’s another inequality: \(x\leq 1\). Let’s graph the inequality on a number line.
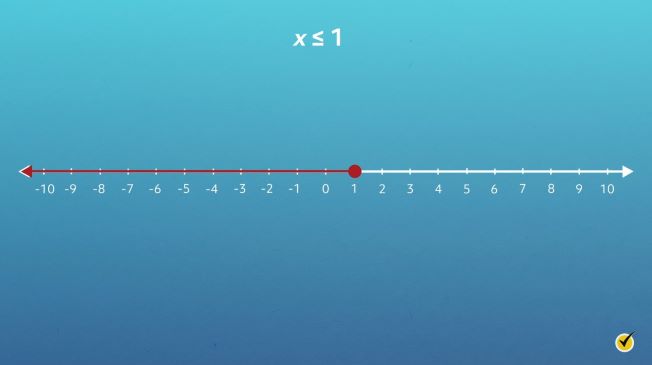
First, find 1 on the number line and draw a shaded circle above it on the number line. The circle is closed to indicate that 1 is part of the solution set for this inequality. Next, starting from 1, draw a line to indicate all other possible solutions for \(x\). Since \(x\) is less than or equal to 1, we need to draw the line to the left of 1.
Now it’s your turn. Graph the solution set for the inequality \(x\geq -4\).
Pause the video here, draw a number line, and try this one yourself. When you finish, resume the video, and we’ll go over the graph together.
Let’s take a look at the number line for \(x\geq -4\):
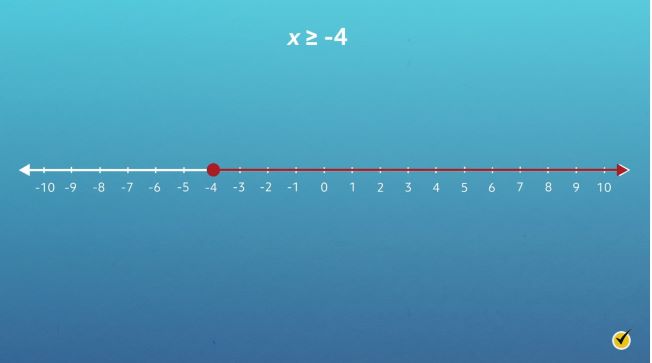
As you can see, the circle above -4 is closed to indicate that -4 is part of the solution set. Since \(x\) is greater than or equal to -4, the line extends to the right, showing all possible solutions for \(x\). Nice work!
A compound inequality is two or more inequalities that are joined together with either “and” or “or”. They are sometimes written with the symbols for “and” and for “or”.
For example, \(x\leq -1\cup\text{ }x> 5\) is a compound inequality that means the same thing as \(x\leq -1\text{ or}\text{ }x> 5\). The possible solutions are all numbers that are either less than or equal to -1 or greater than 5.
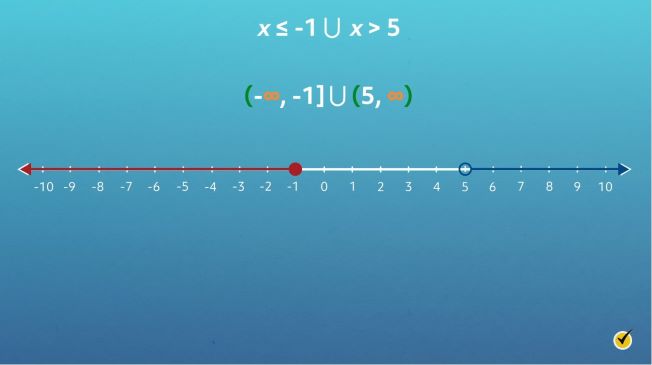
When graphing compound inequalities on the number line, the same rules apply as with simple inequalities. Both inequality statements are graphed on the same number line. Let’s graph the solutions for \(x \leq -1\text{ }\cup x > 5\), starting with the first inequality, \(x \leq -1\). Since \(x \leq -1\), there is a closed circle at \(-1\) with a line extending to its left. Next, graph the solution set for the second inequality, \(x > 5\), on the same number line.
Since \(x > 5\), there is an open circle at 5 with a line extending to its right. The number line now shows all solutions if \(x\) is less than or equal to -1 or greater than 5. Here’s how the solution set can be expressed \(\left ( -\infty ,-1] \cup (5,\infty \right )\) with representing infinity, parentheses indicating open circles not part of the solution set, and brackets for closed circles that are part of the solution set.
Consider the compound inequality \(x > -2\cap x\leq 6\), which can also be written as \(-2 \lt x \leq 6\). Since these two inequalities are connected by “and,” the graph needs to reflect all solutions for \(x\) if it is greater than \(-2\) and less than or equal to 6. Following the same steps before, let’s graph both solutions on the same number line, starting with \(x > -2\).
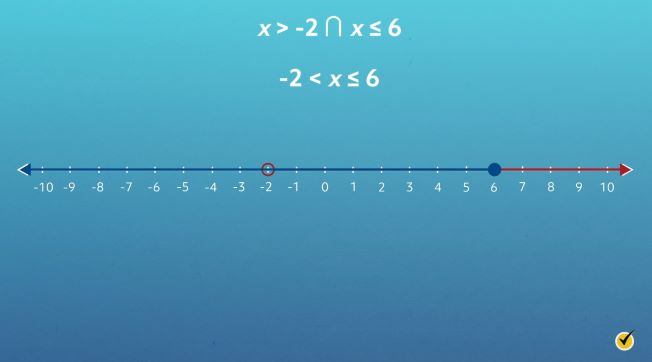
Since \(x > -2\), there is an open circle at -2 with a line extending to its right. Next, graph the solutions for \(x \leq 6\) on the same number line.
Since \(x\leq 6\), there is a closed circle at 6 with a line extending to its left. However, this graph is not accurate. Recall that these inequalities are connected by “and,” meaning that the number line needs to show where solutions to both inequalities overlap.
The number line now shows all solutions for \(-2\lt x \leq 6\).
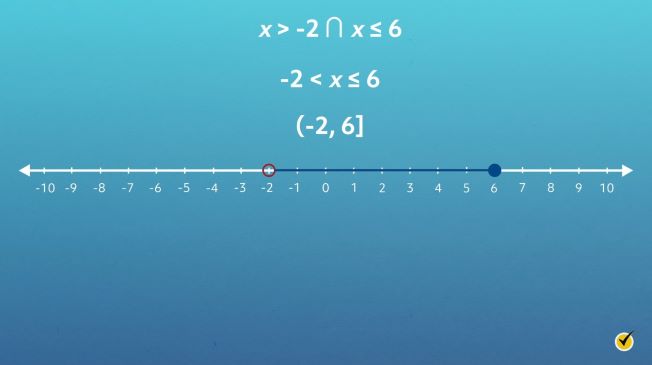
This solution set can be expressed like this \((-2,6]\), with a parenthesis indicating that -2 is not part of the solution set and a bracket meaning that 6 is part of the solution set.
Solutions to inequalities with absolute value can also be graphed on a number line. Recall that absolute value is a number’s distance from zero. In other words, it’s the non-negative value of a number. Absolute value is denoted like this: \(|x|\).
Consider the inequality \(\left | x \right |> 7\). Solutions for \(x\) include all numbers that are more than 7 spaces away from 0 on the number line. Because possible solutions can be positive or negative, we can rewrite this inequality as two inequalities without absolute value bars. \(\left | x \right |> 7\) becomes \(x> 7\) and \(x\lt -7\). Notice that the sign flipped in the inequality \(x\lt -7\). This is because when a negative is multiplied or divided in an inequality, its sign flips.
Now we’re ready to graph \(x> 7\) and \(x\lt -7\). Following the same steps we’ve been practicing, graph both inequalities on the same number line.
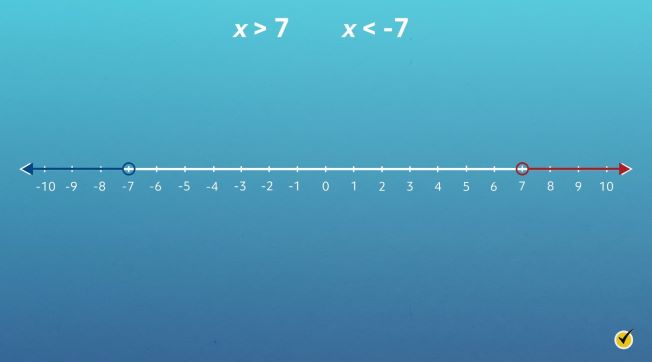
The first inequality states that \(x> 7\), so the graph shows an open circle at 7 with a line extending to the right. The second inequality states that \(x> -7\), so the graph shows an open circle at -7 with a line extending to the left.
Let’s try one more: \(\left | 1+b \right |\leq 8\). The absolute value bars indicate that possible solutions can be positive or negative. Therefore, we need to rewrite the inequality as two inequalities without the absolute value: \(1+b\leq 8\) and \(1+b\geq -8\). Notice that the sign flipped in the second inequality since a negative value was introduced.
From here, isolate the variable \(b\) in both inequalities.
Subtract 1 from both sides, and we’ll get \(b\leq 7\).
\( \)
\(1-1+b\leq 8-1\)
\( \)
\(b\leq7\)
And then we’ll do the same thing over here. Subtract 1 from both sides, and we’ll get:
\( \)
\(1-1+b\geq-8-1\)
\( \)
\(b\geq-9\)
The solution set for this inequality includes all values that are less than or equal to 7 and greater than or equal to -9.
Note that these inequalities are connected by the term “and.” We are looking for solutions that are true for both inequalities, so the number line needs to show where solutions to both inequalities overlap.
The number line now shows all solutions for \(-9\leq b\leq 7\). The solution set can be expressed like this \([-9,7]\), with brackets indicating that -9 and 7 are part of the solution set.
Now it’s your turn. Following the same steps as we’ve practiced, graph the solution set for \(\left | 2x-3 \right |> 5\).
Pause the video here, draw a number line, and try this one yourself. When you finish, resume the video, and we’ll go over it together.
Let’s take a look. First, rewrite the inequality as two inequalities without absolute value bars. After that, isolate the variable \(x\).
So we have \(2x-3> 5\) and \(2x-3\lt -5\).
From here, we’re going to add 3 to both sides. So we have:
\( \)
\(2x> 8\)
And divide by 2 on both sides.
\( \)
\(x> 4\)
Over here we’re going to follow the same steps. We’ll add 3 to both sides.
\( \)
\(2x-3+3\lt -5+3\)
\( \)
\(2x\lt -2\)
And divide by 2 on both sides.
\( \)
\(x\lt -1\)
Now we can graph the solution set for \(x>4\) or \(x\lt-1\).
This solution set can be expressed like this \((-\infty , -1)\cup (4,\infty )\) with parentheses indicating open circles not part of the solution set. Nice work!
So far, we’ve looked at inequalities that contain one variable. What if an inequality has two variables? Consider \(y> 3x+1\). Since there are two variables, we need to illustrate the solution sets on a coordinate plane.
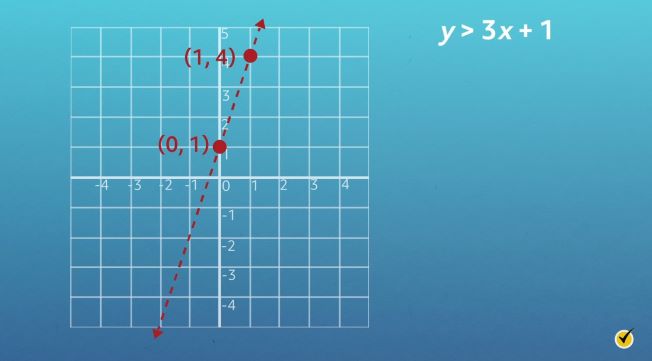
Notice that \(y> 3x+1\) is in slope-intercept form, \(y=\text{ }mx+b\). When an inequality has two variables and is in slope-intercept form, the first step is to graph the line on a coordinate plane. Since the \(y\)-intercept (\(b\)) is 1, the line will intersect the \(y\)-axis at 1, or \((0,1)\). The slope (\(m\)) is 3, or \(\frac{3}{1}\). Starting at \((0,1)\), use the slope to find another point on the line. Since slope is \(\frac{\text{rise}}{\text{run}}\), move up 3 units and right 1 unit to \((1,4)\).
Next, draw a line to connect the points. Since the inequality sign in the original expression is less than (and not less than or equal to), connect the ordered pairs with a dashed line. The dashed line means that points on this line are not possible solutions.
The solution set for a linear inequality is shown as a shaded region on the coordinate plane. This shaded region covers the area either to the right or to the left of the line graphed. To figure out which region to shade, select a test point to substitute into the inequality and solve. An easy test point to work with is the point of origin \((0, 0)\). Substitute 0 for both \(x\) and \(y\) in the inequality.
So we if we have our inequality \(y> 3x+1\) and we substitute in 0 for both \(x\) and \(y\), we’ll get:
So this becomes:
Or:
Which we know is not true.
Since 0 is not greater than 1, then this point \((0,0)\) cannot be part of the solution set. That means the values to the right of the graphed line are not solutions to the inequality. Instead, shade the area to the left of the line.
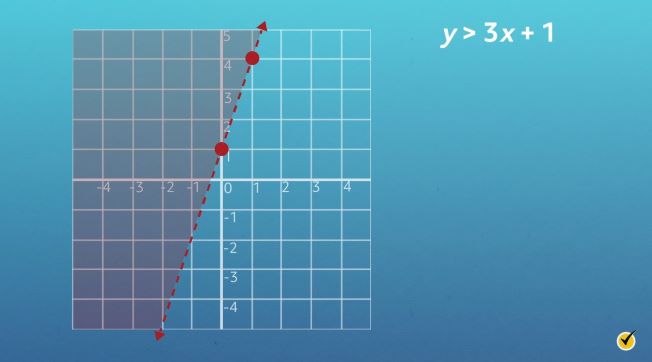
The finished graph has a dashed line with a shaded region to its left. All possible solutions are points to the left of the line graphed.
Let’s try one more. Consider the inequality \(y\leq \frac{2}{5}x+2\). First, graph the line on a coordinate plane. Since the \(y\)-intercept (\(b\)) is 2, the line will intersect the \(y\)-axis at 2, or \((0,2)\). The slope (\(m\)) is 25. Starting at \((0,2)\), use the slope to find another point on the line. Since the slope is \(\frac{\text{rise}}{\text{run}}\), move up 2 units and right 5 units to point \((5,4)\).
Next, draw a line to connect the points. Since the inequality sign is less than or equal to, connect the ordered pairs with a solid line. This indicates that points on this line are possible solutions.
Next, substitute the origin point \((0,0)\) into the inequality as a test point to determine which portion of the coordinate plane to shade.
So if we plug in \((0,0)\) for our \(x\) and \(y\) here, we’ll get:
Which will give us:
Or:
This is true!
Since \(0 \lt 2\), point \((0,0)\) is part of the solution set. That means the values to the right of the graphed line are solutions to the inequality. The finished graph has a solid line with a shaded region to its right. All possible solutions are points to the right of the line or on the line graphed.
Are you ready for a challenge? Let’s take a look at a compound inequality containing two variables:
Remember that connects the two inequalities and means “or.” We can solve this compound inequality by following the same steps we’ve been practicing. The only difference is that now we have two lines to graph on the coordinate plane. Let’s get started.
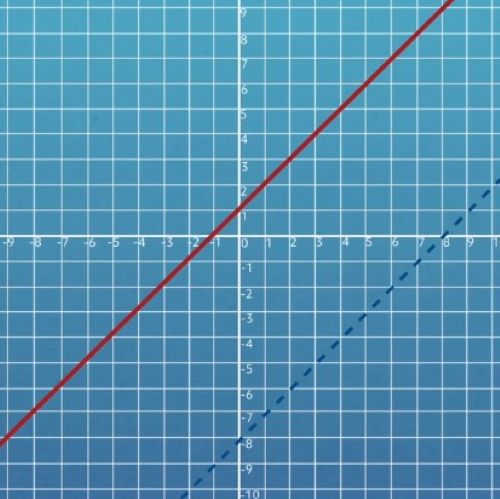
So we have the line \(y\geq x+1\) and the line \(y \lt x-8\).
\(y\geq x+1\) has a \(y\)-intercept at 1 \((0,1)\) and a slope of 1. It is graphed with a solid line to show that points on the line are included in the solution set. \(y\lt x-8\) has a \(y\)-intercept at -8 \((0,-8)\) and a slope of 1. It is graphed with a dashed line to indicate that points on the line are not included in the solution set.
Once the two lines are graphed, substitute the origin \((0,0)\) into both inequalities as a test point. Doing so will determine which portion of the coordinate plane to shade.
So, if we plug in \((0,0)\) here, we’ll get:
\( \)
\((0)\geq (0)+1\)
Or:
We know this is not true. Now we’ll come over here and plug in \((0,0)\). We’ll get:
\( \)
\((0)\lt (0)-8\)
Which simplifies to:
We know this is also not true.
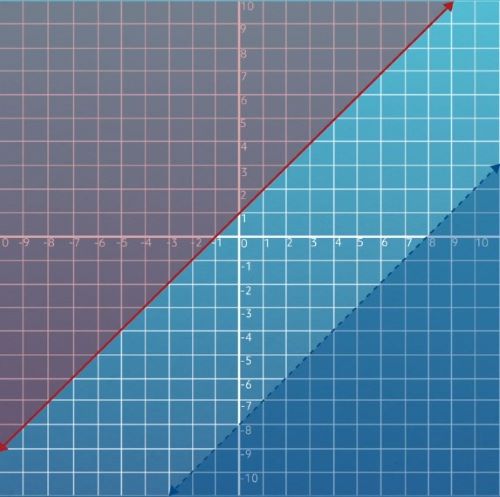
Since both statements are false when solved, shade in both lines on the sides that do not include the origin. \(y\geq x+1\) has a solid line with a shaded region to its left. \(y\lt x-8\) has a dashed line with a shaded region to its right. Both shaded portions are part of the solution set.
We have learned a lot about inequalities today, and I have one more problem for you to try. It’s a little more challenging, but I know you can do it. The inequality statement is:
Remember, compound linear inequalities are graphed on the same coordinate plane. Your first step is to graph the two lines. After graphing, use the test point \((0,0)\) to determine where to shade your graph.
Pause the video here and try this one yourself. When you’re done, resume the video, and we’ll go over it together.
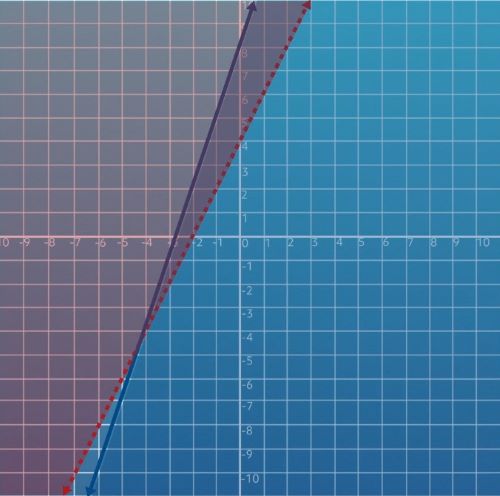
Let’s take a look at this problem together. The two inequalities are \(y>2x+4\) and \(y\leq 3x+8\). When graphed, \(y>2x+4\) has a dashed line, and \(y\leq 3x+8\) has a solid line.
Next, substitute the origin \((0,0)\) into both inequalities as a test point to determine which portion of the coordinate plane to shade.
So if we plug in \((0,0)\) here, we get:
\( \)
\((0)> 2(0)+4\)
Which gives us:
Or:
We know this is not true. Now let’s try it over here. So we have:
\( \)
\((0)\leq3(0)+8\)
Which simplifies to:
Or:
We know this is true.
Based on our work, the origin point should not be shaded for \(y>2x+4\) but should be shaded for \(y\leq 3x+8\). In other words, the dashed line is shaded to its left, and the solid line is shaded to its right.
In this case, the solution set is the area where both shaded portions overlap. Great job!
I hope this video about graphing solutions to linear inequalities was helpful. Thanks for watching, and happy studying!